Shopfloor TV visual management with AI — from the dead board to the board the operator looks at again.
Your shopfloor screens today are dead boards showing yesterday's data. iLEAN connects every TV to the live data of the current shift with Edge and Connect, and lets an agent write the board the way a good shift leader would write it: what is happening, what is coming, what to do now. The person decides; the board informs.
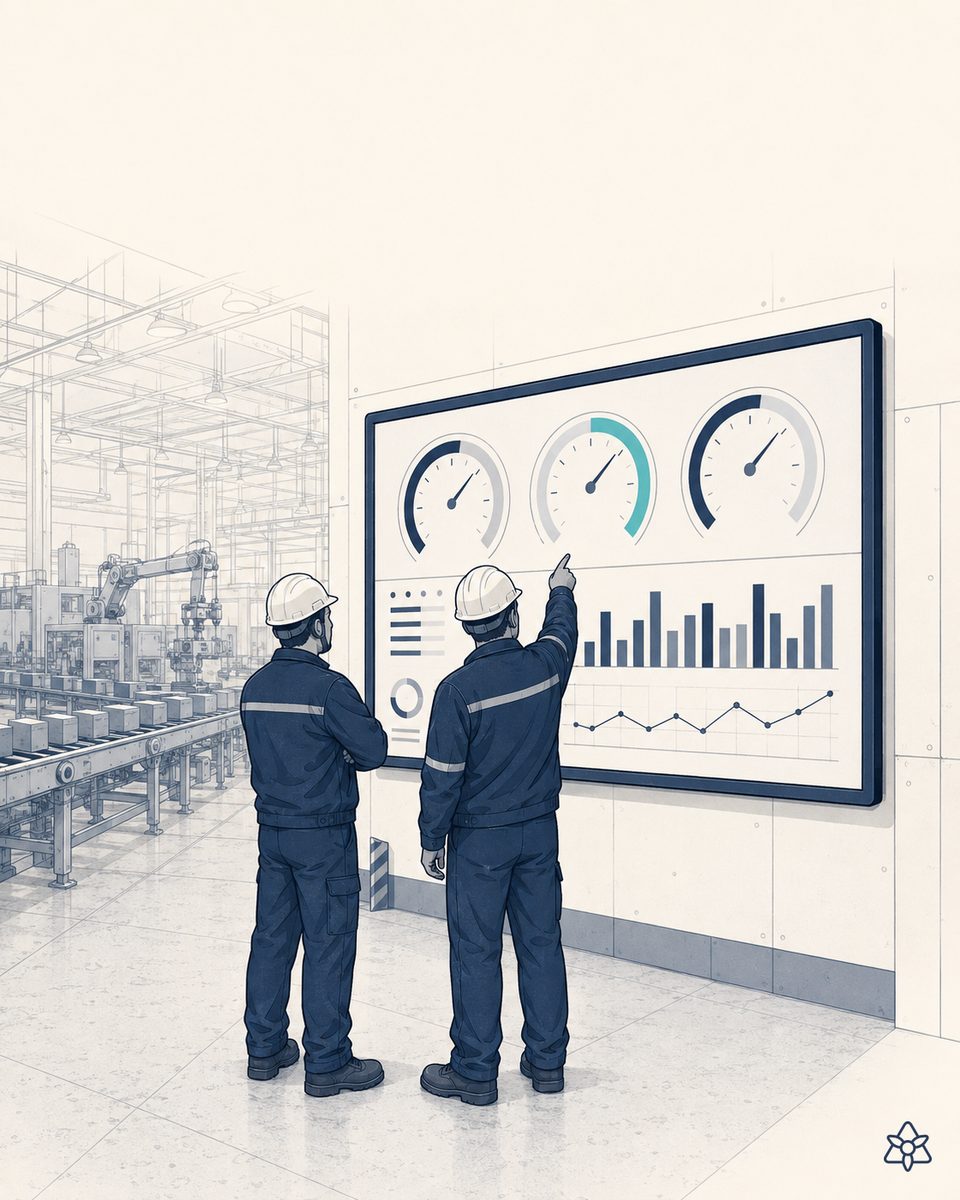
The TV was bought, hung on the wall, wired to the BI — and nobody looks at it.
Three years ago the operations director decided the plant needed visual management "like everyone else has". Six TVs were bought, hung along the aisles and wired to the BI dashboard. For the first month everyone looked at them; by the third, nobody did. Why? Because the screen was showing last month's OEE and a chart the operator does not understand. The data did not belong to the shift. The message was not actionable. The TV became expensive decoration.
The problem was neither the TV nor the BI. It was that the data reaching the TV took a week to cook — ERP extraction, cleansing, aggregation in the data warehouse, dashboard refresh at 6:00 — and the afternoon shift was making decisions with a mirror of seven days ago. Visual management without reality capture is just a poster.
iLEAN does not sell you another TV — it turns the ones you already have into a shift tool.
Live visual management is the visible face of the R in IRIS: bottom-up reality capture. If you capture the data in real time (Edge), if unstructured channels (email, WhatsApp, a photographed analogue panel) arrive at second zero (Connect), and if an agent writes the board in shopfloor language, the TV stops being decoration. iLEAN plugs into the TVs and the BI you already have; it is the filler that seals the crack between "nice data from yesterday" and "useful data right now".
Edge gives you the line's real pace right now. Connect captures what arrives by email or WhatsApp from suppliers and customers at second zero. The agent writes the board in shopfloor language and adapts it to whoever is looking. The TV stops being decoration.
The three iLEAN pieces applied to visual management:
- Edge — vision terminals on every line record pace, stops, defects and events without touching the PLC. What the TV shows is the current cycle, not the monthly average. It works without a network: even if the WiFi drops, the Edge keeps counting and the local board holds up.
- Connect — captures what comes in through human channels (a customer email pulling an order forward, a supplier's WhatsApp delaying material, a photo of the analogue panel on the old machine). The TV reflects those changes at second zero, not at tomorrow's meeting.
- Agent — writes the board the way a good shift leader would: "line 2 at 87% of takt, recovers in 14 min if the changeover lands on time", "SKU changeover on line 3 in 22 minutes, tool X ready". The shift leader's TV is not the line 4 operator's TV; the agent personalizes it. And when there is an andon, it needs nobody to press a button: it detects it from the line.
Dead board vs. live iLEAN board
| Aspect | TV with a classic BI dashboard | With iLEAN Edge + Connect + Agent |
|---|---|---|
| Data freshness | Last 24 h to a week | Second zero, the line's current cycle |
| Current shift context | Generic, no action | Upcoming stops, SKU changeover, alerts |
| Andon | Physical button nobody presses | Automatic detection from the Edge |
| Personalization by role | One screen for everyone | Different view for operator, shift leader, management |
| Capture from an old machine | Not integrated — never shows up | Phone photo of the panel → onto the board |
| Operator readership | Fades within weeks; they stop looking | They look again — because it helps them work |
Impact estimate for your plant — to be validated with your numbers.
This block is an estimate to be validated against the specific plant. Order of magnitude, not a commitment.
- Plant with 6-12 TVs already hung on the walls (no screens to buy, the existing ones are reused), 3-6 active lines, BI already in place showing yesterday's data.
- Connecting the TVs to iLEAN's live data + an agent that writes the board per role. First live board within a few weeks.
- Indicative payback between 4 and 9 months. The hard lever is the reaction minutes gained — every stop detected at second zero instead of at the next meeting is worth money.
- Expected reduction of ≥ 30% in reaction time to shopfloor events, depending on your BI's current cycle and how often the shift actually reacts.
Why this works now
The reasonable doubt — "what if the agent gets the board wrong and misinforms the shift?" — has an answer. In tasks anchored to the source (reading a cycle, comparing it with the plan, writing a message), the agent does not opine: it recontextualizes data anchored to captured reality. A model asked to opine in the abstract fills the gaps; the same model anchored to verifiable evidence — a camera frame, an Edge record, a schedule entry — stops guessing and starts answering [1]. The agent proposes; the shift leader signs off any plan change that reaches the TV. The warm bed: the shift walks in and finds everything already written.
[1] OpenAI paper "Why Language Models Hallucinate", 2025 — on the reliability of AI in anchored tasks.
What people ask about visual management with AI
Why do shopfloor TVs end up as decoration?
Because they show a slide deck or a BI dashboard whose data is from yesterday, with no context about the current shift and nothing actionable. Within a week the operator learns that the screen tells them nothing useful — and stops looking at it. The dead board is not the TV's fault: it is the fault of the data reaching the TV not being the shift's data.
What does a shopfloor TV need in order to be useful?
Three things. One: live data from the current shift (OEE, pace, scrap), not from last month. Two: context from the agent (what is happening, what to expect in the next hour, what to do). Three: a board that adapts to whoever is looking — the shift leader's TV is not the line 3 operator's TV. iLEAN supplies all three, because it captures the data in real time with Edge and Connect, and the agent writes the board in shopfloor language.
Do I have to replace my TVs or my existing software?
No. iLEAN plugs into the TVs you already have — any screen with a browser (a smart TV, a mini-PC, a Raspberry, a Chromebox). And it plugs into your BI or your MES if you have them: the agent reads iLEAN's live data plus the legacy system's data, cross-checks them and publishes the result. Nothing has to be thrown away.
What if the data comes from an old machine with no connectivity?
That is where iLEAN Connect's graduated capture comes in. If the machine has a modern PLC, direct integration. If it has an old, isolated local computer, Connect connects and extracts. If it only has an analogue panel, a person photographs the panel from their phone and Connect digitizes it at second zero. The TV reflects the reality of the whole plant, not just of the modern machines.
What do you see on a live TV in the first week?
Live shift OEE, line andon (what is stopped and since when), upcoming planned stops according to the schedule, agent alerts when a deviation is building up, and the actionable message of the moment ("SKU changeover on line 3 in 22 minutes, get tool X ready"). Within a few weeks the operator starts looking at the screen again — and that only holds if the data genuinely belongs to the shift.
Keep pulling the thread: Andon · Digital gemba · All Lean methods
More cases in lean manufacturing
- Standard work with AI vision — the standard stops being a laminated sheet on the wall and comes back to the station, alive.iLEAN Edge compares the station's sequence against the standard and catches the deviation in the moment.…
- Toyota Production System — the origin of Lean ManufacturingThe Toyota Production System (TPS) is the foundation of modern Lean. Its two pillars — Jidoka and…
- TPM: Total Productive Maintenance with predictive AIiLEAN digitizes TPM with real-time OEE, autonomous and predictive maintenance. The 6 pillars serving…
- VSM — Value Stream Mapping with live dataiLEAN turns your Value Stream Map into a live tool: real cycle time, measured lead time, Muda/Mura/Muri…
- What is iLEAN?Industrial AI &Lean 4.0 platform.iLEAN is an industrial AI platform that digitizes Lean Manufacturing and unifies your whole plant's…
- Workplace safety with AI vision — anticipating the near miss before it becomes an accident.How iLEAN Edge sees near misses and danger zones on the plant floor and warns at second zero — data…
Tell us your case and within 48 h we send you the estimated ROI of bringing your TVs back to life.
We work on your plant's real data, not on ours. Diagnostic with no strings attached.
Request estimated ROI in 48 h See Lean Manufacturing