Muda, mura and muri detection with AI — the 3M before they cost money, not after.
Last month's aggregate OEE hides the 3M. iLEAN detects them continuously: Edge measures the real cycle per station, Connect captures the rhythm of the chain, the agents attribute root cause. Mura, muri and muda stop being a hunch of the continuous improvement manager and become a fact with a timestamp and a probable cause. The person decides what to do.
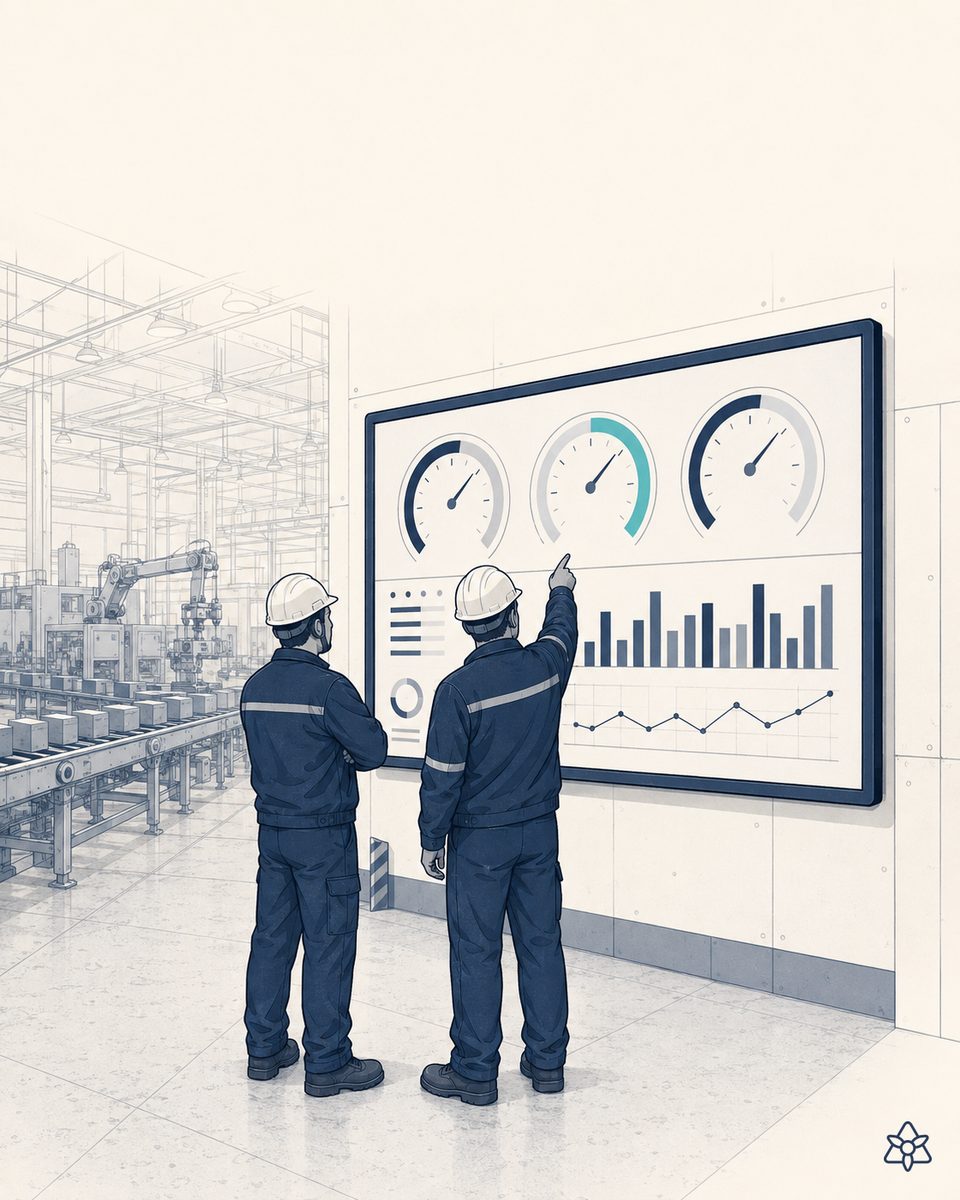
The 3M are not visible — until they cost money.
The continuous improvement manager knows muda, mura and muri are there. They can smell it on every gemba walk. But quantifying them by hand is impossible: measuring the mura of station 4 across a shift would take a technician with a stopwatch for the whole day, and again the next day. Detecting muri in an operator before they burn out would take continuous observation. Mapping muda in material flow would mean a fresh spaghetti diagram every week.
So the manager works with last month's aggregate OEE and the eye of the shift leaders. OEE says the line is at 72%. It does not say why, at which station, at what point in the shift, with which SKU, or who is absorbing the overload so the number doesn't drop further. By the time a 3M problem explodes — an accident, a systemic defect, a veteran who resigns — the cost is already paid, and reconstructing it after the fact takes weeks. Invisible 3M is expensive 3M.
iLEAN turns 3M detection into a by-product of continuous capture.
The 3M are reality-capture problems: if you measured every cycle of every station continuously and at no cost, mura, muri and muda would surface on their own. iLEAN was designed for exactly that — the R in IRIS is the capture of reality from the floor upwards. Without Edge, without Connect and without agents cross-referencing them, the 3M are still only visible after the fact. With the three pieces working together, they are a natural by-product of the system. It is the filler that closes the cracks between ERP/MES/SCADA and the real plant floor.
Edge measures cycle time continuously. Connect captures the rhythm of the chain (shift changes, material shortages, customer messages). The agent cross-references and attributes root cause. The person decides what to fix.
The three iLEAN pieces applied to 3M detection:
- Edge — vision terminals per station detect the milestones of the cycle (part in, operation starts, operation ends, part out) without touching the PLC. Every cycle is compared with takt and with the history of that specific operator and SKU. That is how mura (cycle variance) and muri (cycles sustained above takt) emerge. It works without network: even if the WiFi drops, the Edge keeps measuring.
- Connect — captures the rhythm of the chain the Edge cannot see: shift changes, raw material arriving late, a supplier message that changes the plan, the operator's voice saying "the grease on line 5 is giving us trouble". Without that capture, mura would be seen but not attributed. Connect is the filler.
- Agent — cross-references Edge data with Connect data and with ERP/MES. It identifies patterns: "the mura at station 3 appears when we change to the green SKU and the operator is new", "the muri of operator X happens when material arrives 8 min late and they compensate by rushing the cycle". It attributes a probable root cause. The person prioritizes and acts.
The 3M with classic OEE vs. with continuous iLEAN detection
| Aspect | OEE + the manager's eye | With iLEAN Edge + Connect + Agent |
|---|---|---|
| Muda visibility | Only what the eye catches or what becomes a logged defect | Continuous, per station, per SKU, per shift |
| Mura detection | One-off audit, days or weeks | In the moment, with a timestamp |
| Muri detection | When the operator burns out or resigns | Earlier — a sustained pattern within a few shifts |
| Root-cause attribution | Manual reconstruction, biased by memory | Agent cross-references Edge, Connect and ERP — a concrete proposal |
| Measurement frequency | Monthly (OEE), quarterly (studies) | Every cycle |
| Marginal cost of measuring more | Every extra measurement = a stopwatch and a technician | Zero — the camera is already there |
Impact estimate for your plant — to be validated with your numbers.
An estimate to be validated with the concrete data of the line. Order of magnitude, not a commitment.
- Production line with OEE stable at 65-78%, continuous improvement active but with no traction to move up, suspected mura on SKU changeovers and muri at one or two workstations.
- Edge pilot over 6-10 critical stations + a 3M detection agent. First quantified map in a few weeks.
- Indicative payback between 4 and 9 months. The hard lever is not raising OEE — it is understanding why it does not rise, attributing cause, and removing it. The continuous improvement manager stops timing and starts correcting.
- Expected reduction of undetected muda ≥ 30% in the first months, depending on the real starting point.
The underlying data
According to research by Fundación BBVA / Ivie, the most digitized sectors raised their productivity by up to 40% compared with the least digitized ones between 2000 and 2021. Invisible 3M is exactly the kind of loss that continuous data attacks and a monthly paper report does not. And the reasonable question ("what if the agent attributes the root cause wrongly?") has an answer: in anchored tasks (cross-referencing time series, comparing against history), the best models pushed the error below 1.5% [1]. The agent proposes a probable cause; the continuous improvement manager validates it and acts. The decision stays human.
[1] OpenAI paper "Why Language Models Hallucinate", 2025 — on the reliability of AI in anchored tasks.
What people ask about 3M detection with AI
What are muda, mura and muri in lean?
They are the 3M of the Toyota Production System. Muda is pure waste (everything the customer does not pay for: waiting, unnecessary transport, overproduction, overprocessing, inventory, motion, defects, unused talent). Mura is variability (irregular rhythms, peaks and troughs that break flow). Muri is overload (people and machines pushed beyond their sustainable capacity). The three are connected: muri and mura produce muda — attacking waste alone without removing variability and overload is patching the symptom.
Why are the 3M spotted so late in a traditional plant?
Because the only continuous measure many plants have is OEE, and OEE aggregates muda, mura and muri into a single number from last month. Invisible muda (small waits, unnecessary motion the manager's eye never counts) and mura (rhythm spikes lasting minutes) never show up on the board. Muri becomes visible when an operator burns out at the end of a shift — too late. iLEAN turns continuous 3M measurement into a natural by-product of the Edge, with no manual stopwatch work.
How does iLEAN detect mura (rhythm variability)?
Edge measures every station's cycle time continuously (vision over the line, without touching the PLC). An agent compares the current cycle with takt and with the historical cycle for that station, that SKU and that operator. If variance passes a threshold, the mura is flagged with a probable cause: «mura at station 3 from 11:20 — coincides with the welder shift change, wire Y ran out 4 min ago». That root-cause attribution is what the continuous improvement manager does by hand today, over days.
And muri (operator overload)?
Sustained muri is detected by cross-referencing cycle time, number of micro-stoppages, heart rate or posture where a wearable exists, and the operator's own voice feedback into Connect. When a workstation runs systematically above takt across a long shift, the agent flags it before the operator burns out. The action belongs to the supervisor — the system flags, the person decides how to rebalance or relieve.
What about the 8 classic wastes of muda?
iLEAN covers them with Edge vision over the lines (waiting, motion, overprocessing, defects), with Connect capture across the logistics chain (unnecessary transport, inventory), and with Agents cross-referencing the plan (overproduction) and people development (unused talent: the operator who knows how to do X and whom nobody has ever asked to teach others). We cover this in depth on the 8 wastes with AI vision page.
Related: 8 wastes with AI vision · Live Yamazumi · Heijunka
More cases in lean manufacturing
- Living FMEA with AI — the risk map that updates with what actually happens on the line, not with what was estimated two years ago.iLEAN links every real line event to its failure mode, recalculates observed vs. estimated occurrence…
- The classic MES replans at the end of the day. Your plant changes every hour.iLEAN augments your existing MES/MRP with dynamic planning and replanning in minutes when something…
- MSA with AI — the study that ages in a drawer comes back to life.iLEAN assists MSA (R&R, bias, linearity, stability): Connect captures the real measurement and Agents…
- Incident capture — the one that dies in a chat message is the one that happens again.iLEAN turns voice, photo, email and chat into a categorized incident and a prioritized action in MES,…
- Near misses with AI — the warning the plant gives itself, captured before the hit.iLEAN Edge sees the near miss on the line, Connect captures it by voice and an agent classifies it to…
- Real-time OEE: availability × performance × qualityiLEAN measures OEE in real time: availability × performance × quality, by line, shift, product. The king…
Tell us about your case and within 48h we'll send you the estimated ROI of a live 3M map for your line.
We work on your plant's real data, not on ours. Diagnostic with no commitment.
Request estimated ROI within 48h See Lean Manufacturing