Yamazumi and line balancing with AI — from the notebook stopwatch to a live plant-floor chart.
A classical Yamazumi is built with a stopwatch, lasts a quarter and dies with the first SKU change. iLEAN measures the real times of every operator with Edge vision, cross-references the plan with Connect, and leaves the supervisor a live Yamazumi per SKU and per shift. The person decides the rebalance — the stopwatch stops giving orders.
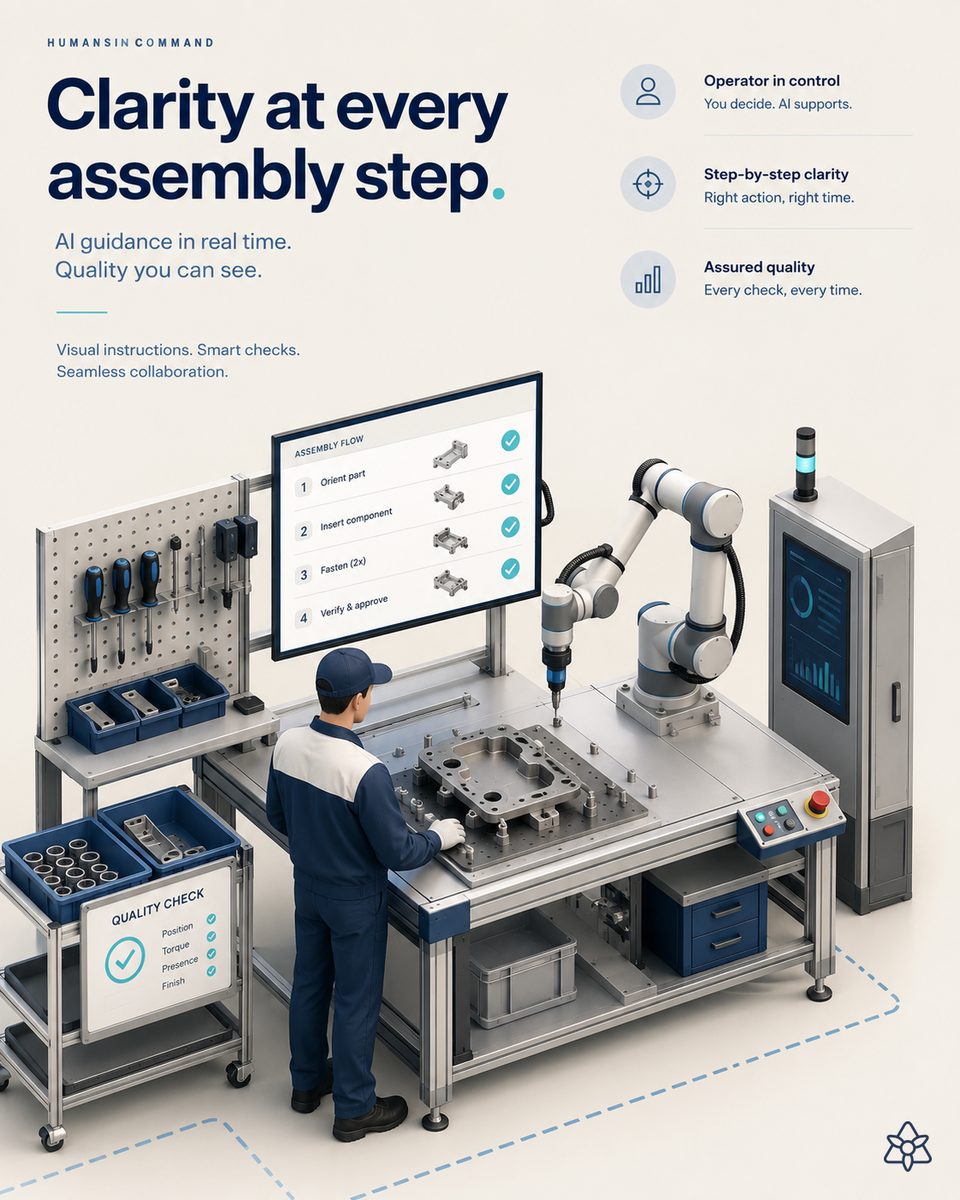
The Yamazumi is obsolete the day it gets printed.
The industrial engineer spends three days with a stopwatch in hand, times five different operators on five different SKUs, averages the results, draws the stacked bars and presents the balance to the committee. The following Monday a new SKU comes in, an old one goes out, a veteran operator leaves on holiday, and the Yamazumi on the wall stops matching what the line actually does.
The supervisor knows it. They can feel it in the first shift: one station is always rushing (muri), another is standing by (muda), and the bottleneck moves on its own every time the mix changes. But a formal rebalance costs another three days of stopwatch work, so the line keeps running on a balance calculated months ago, patched with craft and instinct. The problem is not that people don't know Lean — it's that measuring reality is so expensive that it gets measured once a quarter, and the plant spends the rest of the year drifting.
iLEAN turns the stopwatch into a permanent sensor — and the engineer into a decision-maker.
Line balancing is a classic reality-capture problem: if you could measure every cycle of every operator at no cost, you would balance continuously. Measuring used to be expensive, so it was done rarely. iLEAN acts as the filler that seals the gap between the ERP/MES (which knows which SKU is due), the line (which knows how long it really takes) and the industrial manager (who decides how to move the work). It replaces no system — it connects them.
Edge times every station at once, without stopping. Connect cross-references the plan and the changes that arrive by message. The agent proposes the rebalance to the supervisor. The person signs off — the agent never changes a balance on its own.
The three iLEAN pieces applied to line balancing:
- Edge — a vision terminal per station detects the cycle milestones (part in, operation starts, operation ends, part out). There is no need to touch the PLC or wire new sensors; the camera learns to read the operation the way we would read it. Real times per operator, per SKU and per shift, continuously. It works offline: the measurement cycle keeps running even if the WiFi drops.
- Connect — captures the plan from the ERP/MES and the last-minute changes wherever the data comes from: a customer email pulling an order forward, an instant message from the production manager moving a SKU, a spreadsheet from the planner changing the sequence. The filler that seals the cracks between the official systems and the real channels where decisions actually happen.
- Agent — recalculates the Yamazumi live per SKU and per shift, compares it with the current takt, identifies the station drifting into muri and the one drifting into muda, and proposes a concrete rebalance to the supervisor (move this sub-operation from station 3 to station 2, split this inspection between 4 and 5). The person decides.
Stopwatch balancing vs. a live iLEAN Yamazumi
| Aspect | Stopwatch + notebook + spreadsheet | With iLEAN Edge + Connect + Agent |
|---|---|---|
| Measurement frequency | A study every 3-6 months, days of work | Every cycle, continuous, no marginal cost |
| SKU coverage | One sample of the "representative" SKU | Every real SKU that runs down the line |
| Reaction to a mix change | The Yamazumi on the wall is not updated | The agent recalculates and proposes a rebalance per shift |
| Muri detection | When the station breaks down at the end of the shift | When the cycle drifts systematically from takt |
| Muda (waiting) detection | Seen by eye, never quantified | Quantified per station, per SKU and per shift |
| Who runs the time study | A technician, 3 days, everything else on hold | The camera — the technician decides what to do with the data |
Impact estimate for your plant — to be validated with your numbers.
An estimate to be validated with the specific data of your plant. Order of magnitude, not a commitment.
- Pilot line: 6-10 stations, multi-model assembly (tier-2 automotive, electronics, medical device, appliances). A mix of 8-15 active SKUs per week.
- Edge over each station + Connect against the ERP/MES + Agent working with the supervisor. First live Yamazumi in a few weeks.
- Indicative payback between 4 and 9 months, depending on the current cost of your time studies, how often the mix changes and how much muri/muda the line carries today.
- Expected reduction of total cycle time ≥ 30% of the imbalance the line absorbs today (the slack between the slowest station and takt), not of takt itself.
And the underlying fact that closes the case
Continuous line balancing is exactly the lever that turns digitization into plant-floor productivity — the same team, the same machines, a different rhythm. The reasonable doubt of "what if the AI gets a cycle wrong?" is legitimate, and the answer is direct: hallucinations are a problem of free generation; in tasks anchored to the source (reading the cycle and comparing it with the standard), the best models brought error below 1.5% [1]. And even so, nothing critical is decided alone: the agent proposes, the supervisor signs off.
[1] OpenAI paper "Why Language Models Hallucinate", 2025 — on the reliability of AI in anchored tasks.
What people ask about Yamazumi and AI line balancing
What is a Yamazumi chart and what is it for on the plant floor?
A Yamazumi is a stacked bar chart that shows the work content of each operator on a line, compared with takt time. It lets you see at a glance which station is overloaded (muri), which one is waiting (muda), and where work can be moved so the line flows without bottlenecks. The classic problem is that the Yamazumi is built with a stopwatch and a notebook once a quarter, and a week later it no longer reflects reality.
How does iLEAN measure each operator's cycle time in real time?
iLEAN Edge installs computer vision (CNN) over each station on the line and detects the cycle milestones — part in, operation starts, operation ends, part out — without touching the PLC or adding sensors to the workstation. That gives real times per operator, per SKU and per shift, not estimated averages. Connect cross-references those times with the production plan that lives in the ERP/MES and with the changes that arrive by email or instant message halfway through the shift.
How often should a high-mix line be rebalanced?
The higher the mix, the less a quarterly balancing is worth. On multi-model lines (tier-2 automotive assembly, consumer electronics, medical device) the work content changes when the SKU changes, and takt adjusts with demand. The reasonable target is for the supervisor to have the Yamazumi recalculated per SKU and per shift, and to step in only when the agent detects that a station is running systematically above takt or well below it.
Isn't a classical time study enough to balance a line?
It works — the problem is frequency. A classical study is run every few months, ties up a technician for days and goes stale as soon as the SKU changes, a new operator joins or a tool is modified. With iLEAN the time study becomes continuous: the camera is always there, the agent compares every cycle with the standard and flags the deviation when it is structural, not anecdotal. The industrial engineer stops timing cycles and starts deciding what to do with what the data shows.
How long does it take to show on a multi-model assembly line?
The first live Yamazumi of the pilot line is usually up within a few weeks, with times per operator and per SKU and a concrete rebalancing proposal from the agent. The hard lever is removing muri (the overload that used to break a station by the end of the shift) and muda (the waiting of whoever depends on the bottleneck). We send you a payback estimate within 48h using the data of your product mix and your takt.
Related: Heijunka (production leveling) · Dynamic takt time · Muda/mura/muri detection
More cases in lean manufacturing
- Workplace safety with AI vision — anticipating the near miss before it becomes an accident.How iLEAN Edge sees near misses and danger zones on the plant floor and warns at second zero — data…
- Workstation ergonomics with AI — anticipating the musculoskeletal disorder before the sick leave.iLEAN Edge runs pose estimation on the line — skeleton, not faces — and the agent cross-checks RULA/REBA…
- X̄-R control charts with AI — drift shows up before the subgroup closes.iLEAN streams the X-bar R chart over real shop-floor data and an Agent applies Western Electric / Nelson…
- 5S: visual order and discipline, digitizedHow iLEAN digitizes 5S: photo-evidenced audits, geo-tagged deviations, drift alarms. 25 years applying…
- The 8 lean wastes with AI vision — the map no manager could ever build by hand.Overproduction, waiting, transport, inventory, motion, defects, unused talent: iLEAN detects the 8 lean…
- 8D problem solving with AI — the eight disciplines fed by live data, not by a template filled in after the fact.The 8D stops dying in a Word template: all eight disciplines feed on live plant data. An agent drafts…
Tell us about your case and within 48h we'll send you the estimated ROI of a live Yamazumi for your line.
We work on your plant's real data, not on ours. Diagnostic with no commitment.
Request estimated ROI within 48h See Lean Manufacturing