X̄-R control charts with AI — drift shows up before the subgroup closes.
The X̄-R chart is still the most honest way to separate common variation from special cause. The problem is not the chart — it is that the data arrives late and someone builds the subgroups by hand. iLEAN Connect captures the measurement at the workstation, an Agent applies the Western Electric / Nelson rules to the streaming chart and alerts the shift supervisor through the channel they use. The decision to intervene stays human.
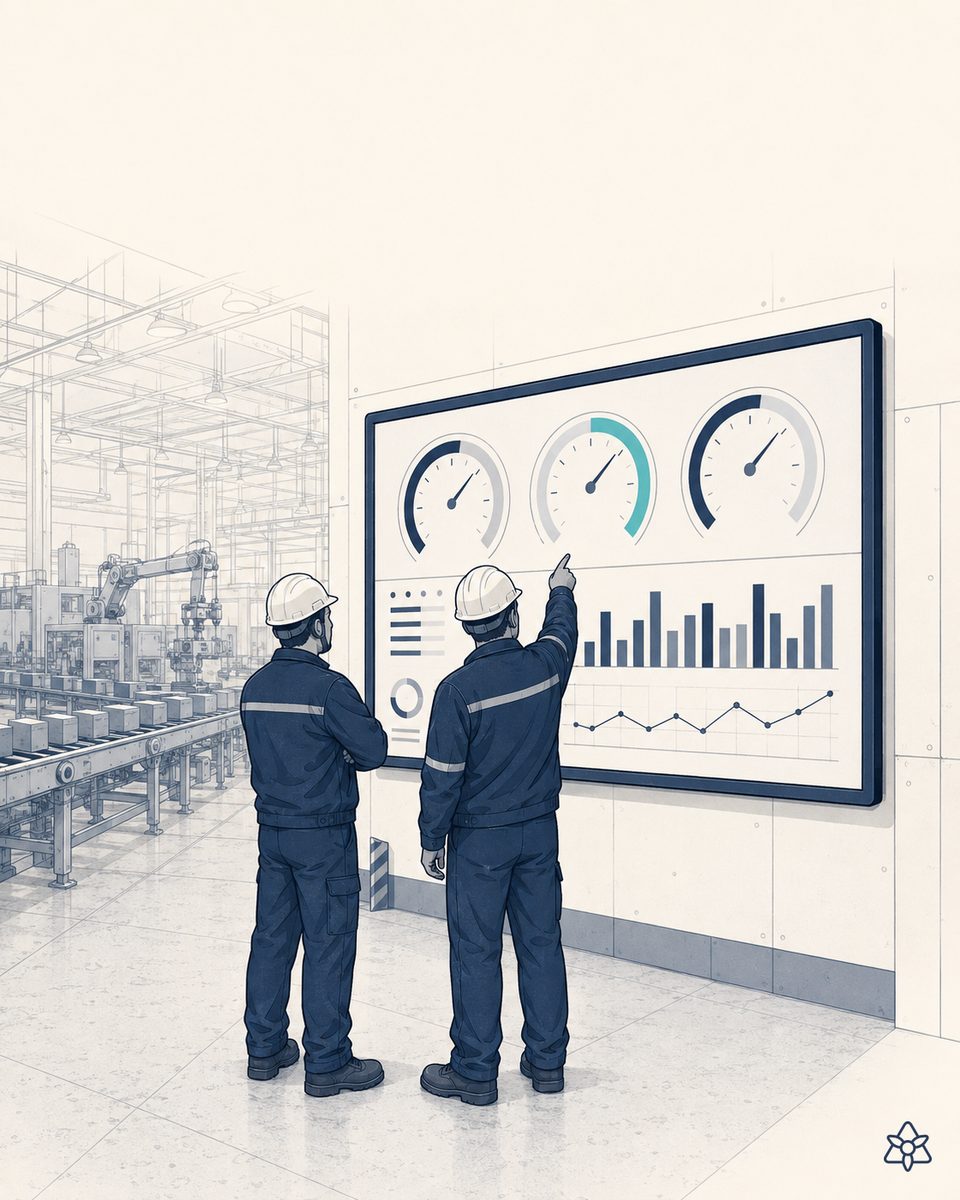
SPC does not fail because the statistics are bad — it fails because the data arrives late.
The X̄-R chart dates from the 1920s and it is still correct. What has expired is not the theory — it is the operation: the operator writes the measurement on a sheet, the technician types it into a spreadsheet at the end of the shift, the quality engineer looks at the chart on Friday. By then the drift has been producing scrap for three shifts, and the Western Electric rule fired 40 parts ago.
In multi-product plants it gets worse: subgroups mixed across SKUs, false alarms the team learns to ignore, and SPC ends up as decoration. The quality manager knows it — and distrusts it. Not the tool, but the chain that carries the measurement from the workstation to the chart.
The classic setup (sheet plus spreadsheet plus weekly review) works 99% of the time. That 1% is precisely when expensive scrap is about to be produced or when the OEM customer files a claim for an out-of-spec dimension. The whole point of SPC was to anticipate — and without in-line capture it arrives late almost by definition.
iLEAN does not add another SPC package — it puts live data underneath the chart you already have.
The problem with SPC is not a lack of statistical software (there are good packages out there). It is that the data lives in islands: the digital gauge probe, the sheet at the workstation, the MES that does not speak to the probe, the quality manager's spreadsheet. iLEAN acts as the filler that seals those cracks — without asking you to change your SPC software or your MES.
Edge measures where there is vision. Connect carries the data where there is a digital gauge or a manual entry. The Agent computes the chart and evaluates the rules. The person decides whether to intervene.
The iLEAN pieces applied to X̄-R charts:
- Connect — captures every measurement at second zero with its context (dimension, product, operator, shift, machine). If a digital probe reads the dimension, it integrates directly. If an operator records it on a tablet, the Connect app captures it. If it only shows on the machine's old panel, a camera reads it. The measurement is not lost because it was "not integrated".
- Agents — build the correct subgroup (separating the active SKU), plot the X̄-R chart in streaming, evaluate the active rules (Western Electric, Nelson) and, when one fires, propose to the shift supervisor the most likely special cause for that pattern. The judgement to intervene still belongs to the manager.
- Edge — for dimensions measured by a camera (size, presence/absence, defect). Every part is a measurement, the subgroup builds itself, and the drift shows on the workstation tablet, not in Friday's meeting. Combined with the powder coating pattern (intervention before the oven), the SPC loop closes in milliseconds.
Reactive SPC vs. live SPC with iLEAN
| Aspect | Classic SPC (sheet + spreadsheet) | With iLEAN Connect + Agents |
|---|---|---|
| Data capture | Operator writes it down or exports at end of shift | Probe, Edge or tablet capture at second zero |
| Subgroup construction | Manual in a spreadsheet, mixes SKUs at changeover | Agent groups by active SKU automatically |
| Western Electric / Nelson rules | Watched by whoever looks at the chart on Friday | Evaluated on every new data point, immediate alert |
| False alarms | Routine, caused by mixed SKUs | Filtered by product context |
| Special-cause diagnosis | "We'll look at it next week" | Agent proposal to the shift supervisor on the channel they use |
| Auditor evidence file | Rebuilt from the spreadsheet | Chart + rules + corrective action with full lineage |
Impact estimate for your plant — to be validated with your numbers.
Block flagged as an estimate to be validated with concrete data from your plant.
- Multi-SKU plant with an SPC control plan on 4-8 critical dimensions, several SKU changeovers per shift, documented scrap and rework.
- Connect + Agent pilot on one characteristic dimension (the one that generates the most scrap). First value expected within a few weeks.
- Indicative payback between 4 and 9 months, depending on volume and unit cost.
- Defensible floor: reduction of scrap attributable to undetected drift of ≥30%. A single avoided OEM claim pays for the pilot.
And the CAIO's reasonable objection
"What if the Agent misclassifies a Western Electric rule?" — hallucination is a problem of free generation, not of anchored tasks. Evaluating a rule against measured data is an anchored task: the best models brought the error below 1.5% [1]. And even so, the decision to intervene stays human: the Agent proposes, the shift supervisor decides. The three safety rings exist precisely for that.
[1] OpenAI paper "Why Language Models Hallucinate", 2025 — on the reliability of AI in anchored tasks.
What people ask about X̄-R control charts with AI
What is an X̄-R control chart and what is it for today?
The X̄-R chart (X-bar R) is the classic SPC tool for measurable variables. One chart plots the subgroup mean (X̄) and the other the range (R); together they separate common variation (the process working as designed) from special cause (something changed). They work exactly as they did 80 years ago — the difference is that today, with AI vision and in-line capture, subgroups build themselves and Western Electric or Nelson rules are evaluated in milliseconds, not in the weekly meeting.
Which Western Electric / Nelson rules does the Agent handle?
All of the catalogue, with the caveat that which ones matter depends on the process. The classics: one point beyond 3σ, two of three consecutive points beyond 2σ, four of five beyond 1σ, eight consecutive points on the same side of the mean, trends, cycles, mixtures. The Agent evaluates every active rule each time a measurement arrives; when one fires it does not send an email at 10 pm: it alerts the shift supervisor through the channel they actually use (phone plus earpiece, tablet, andon board) and proposes which special cause best matches the drift. The decision to intervene stays human.
How does Connect build the subgroup in a multi-product plant?
Connect captures every measurement with the context of the production order: product, characteristic dimension, machine, operator, shift. The Agent groups by whatever dimension the control plan specifies (five parts per subgroup every hour, five units per coil, whatever applies), and ignores measurements that do not belong to the active subgroup. In a multi-product plant where the SKU changes several times per shift, that avoids the classic spreadsheet problem: mixed subgroups that trigger false alarms and end up teaching the team to ignore the chart.
Does it work when the measurement comes from an iLEAN Edge camera?
Yes — and that is where the value shows fastest. Edge measures every part (dimension, colour, presence/absence) at second zero, the Agent builds the subgroup and the X̄-R chart comes alive on screen. When a rule fires, the operator sees it on the workstation tablet before producing anything else. Combined with the powder coating case (defect detection before the oven), the effect is two-stage jidoka: first the part, then the drift.
Is the ROI reasonable for a small or mid-size plant?
Yes, provided the pain already exists in product you scrap or rework. The typical pilot covers digital capture of one characteristic dimension at one workstation (gauge, digital probe or Edge camera) plus the Agent that plots the X̄-R chart and evaluates the rules. The hard lever is scrap avoided and rework reduced; small amounts repeated across the year pay back fast. Send us the data for that dimension and the defect history, and we return the estimated ROI in 48h with your own numbers.
Related topics: Lean Manufacturing methods
More cases in lean manufacturing
- What is iLEAN?Industrial AI &Lean 4.0 platform.iLEAN is an industrial AI platform that digitizes Lean Manufacturing and unifies your whole plant's…
- Workplace safety with AI vision — anticipating the near miss before it becomes an accident.How iLEAN Edge sees near misses and danger zones on the plant floor and warns at second zero — data…
- Workstation ergonomics with AI — anticipating the musculoskeletal disorder before the sick leave.iLEAN Edge runs pose estimation on the line — skeleton, not faces — and the agent cross-checks RULA/REBA…
- Yamazumi and line balancing with AI — from the notebook stopwatch to a live plant-floor chart.iLEAN measures real cycle times per operator with Edge vision, catches plan changes and leaves the…
- 5S: visual order and discipline, digitizedHow iLEAN digitizes 5S: photo-evidenced audits, geo-tagged deviations, drift alarms. 25 years applying…
- The 8 lean wastes with AI vision — the map no manager could ever build by hand.Overproduction, waiting, transport, inventory, motion, defects, unused talent: iLEAN detects the 8 lean…
Tell us your case and in 48h we return the estimated ROI of live statistical control in your plant.
We work on your plant's real data, not on ours. Diagnostic with no strings attached.
Request estimated ROI in 48h See Lean Manufacturing