Lean Manufacturing · The king KPI
Real-time OEE: availability × performance × quality
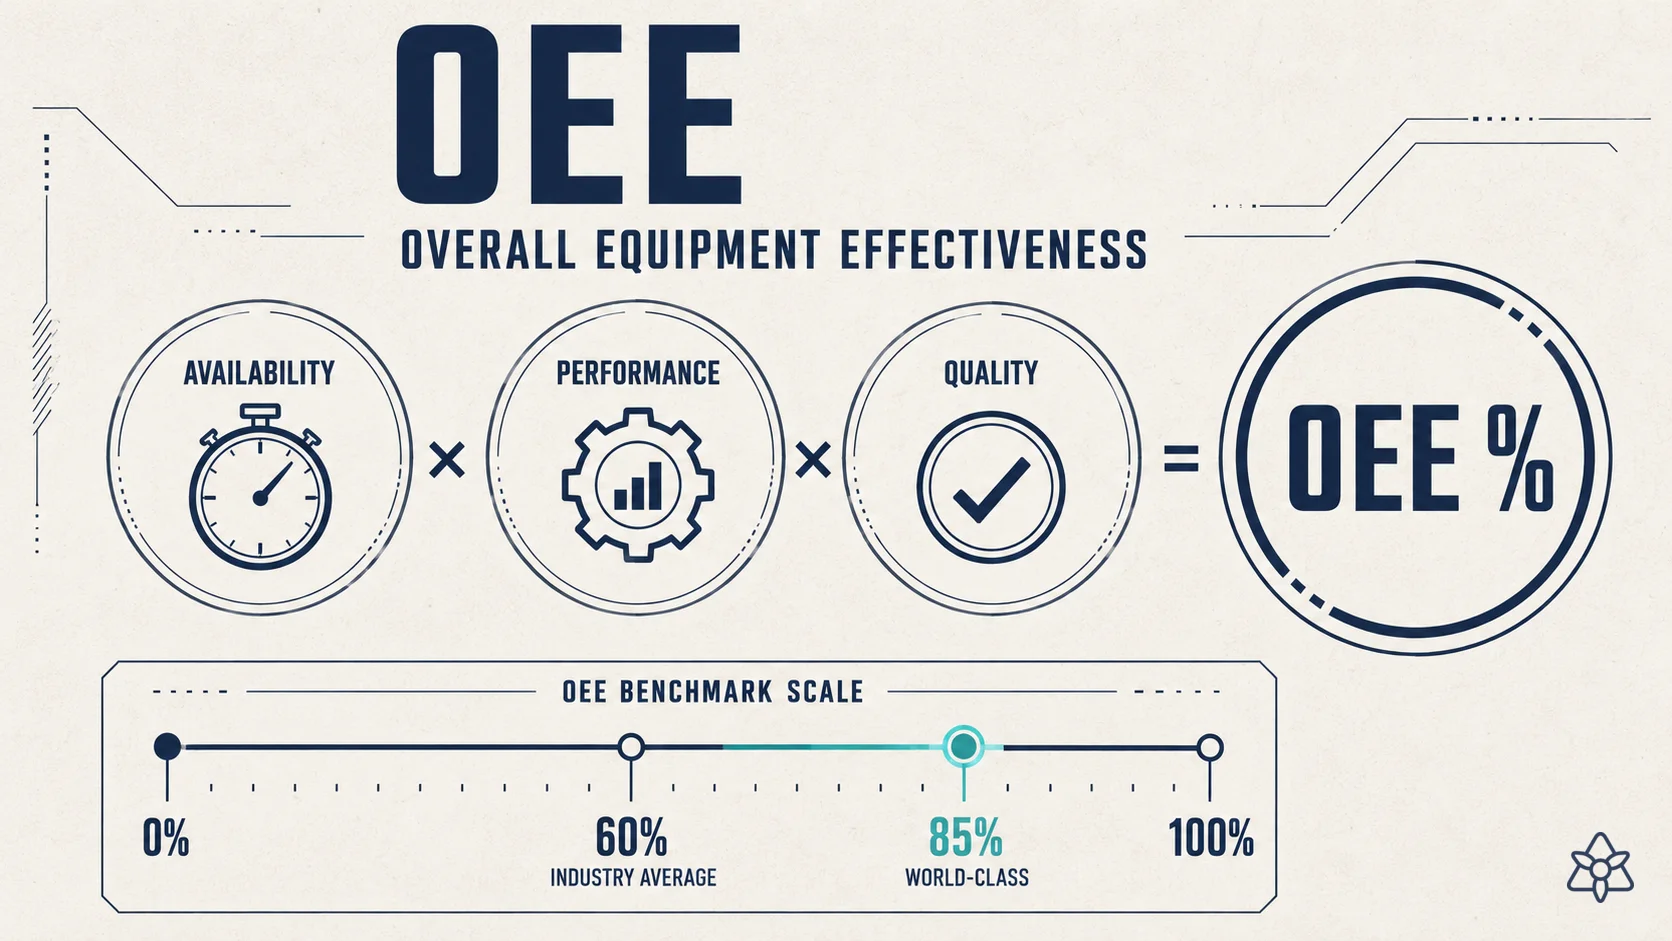
OEE (Overall Equipment Effectiveness) is the king KPI of Lean Manufacturing: the product of Availability × Performance × Quality. It measures the fraction of planned production time that your equipment actually produces good parts at ideal speed. 85% is considered world-class; the average in real plants hovers around 60%.
The three losses that OEE attacks
OEE decomposes machine performance into three independent dimensions — and that's why it's so useful: it tells you where the loss is, not just that there is one.
- Availability (A): % of planned time the machine is actually producing (subtracts stops). Losses: breakdowns, changeovers, material shortage.
- Performance (P): % of ideal speed at which it actually produces when running. Losses: micro-stops, reduced speed, jams.
- Quality (Q): % of produced parts that are valid. Losses: rejects, rework.
OEE = A × P × Q. An OEE of 50% typically breaks down as A=80% × P=80% × Q=78%. Raising 5 points in each = rising from 50% to 75%.
iLEAN doesn't replace the method — it brings it into the 21st century.
Every Lean methodology was born to solve an information problem: where stock is, which machine is failing, what changed shift-to-shift. When information is paper, methods are rituals. When it's live data, they become the actual engine of the plant.
Classical method tells you what to measure. The IRIS system guarantees the measurement reaches whoever decides, the moment they decide — without anyone typing it in.
The three capture layers applied: Connect (photo, voice, email, WhatsApp), Edge (computer vision on the line) and Integrations (ERP/MES/SCADA/PLC). On top of that unified information, specialized agents serve the exact context to each person on the floor.
Manual OEE vs. real-time OEE with iLEAN
| Aspect | Classical Excel OEE | OEE with iLEAN |
|---|---|---|
| Calculation frequency | Monthly or weekly | Real-time (every minute) |
| Stop capture | Operator notes it (if they remember) | Automatic from PLC + cause analysis |
| Ideal speed | Catalog assumption | Learned from historical best performance |
| Micro-stop detection | Invisible | Visible — they're the #1 hidden cause |
| Line benchmark | Monthly summary | Live internal benchmark dashboard |
What people ask about OEE
What is OEE and how is it calculated?
OEE = Availability × Performance × Quality. It's the most-used KPI in Lean Manufacturing to measure the real efficiency of a machine or line. It measures the fraction of planned time the machine produces good parts at ideal speed.
What's a 'world-class' OEE and how does it compare to the average?
World-class: 85% (typically A=90% × P=95% × Q=99%). Average in real plants: 60%. Going from 60 to 85 is typically an 18-36 month project of serious work on TPM, SMED, quality control and culture.
How does iLEAN measure OEE without operator data entry?
iLEAN connects to the PLC/SCADA to detect stops automatically, and uses computer vision to count valid vs. defective parts. The operator just confirms the cause of long stops (short ones are auto-categorized). OEE updates live, with no manual input.
Is OEE the same as operational efficiency?
Not exactly. OEE measures only planned production time (subtracts scheduled stops like maintenance). OOE (Overall Operations Effectiveness) includes planned stop time. And TEEP (Total Effective Equipment Performance) measures against the full 24/7 calendar. iLEAN reports all three.
On what kind of machines does OEE make sense?
Any machine or line that's a bottleneck of the process. Measuring OEE on an over-spec'd machine adds no value — it'll always be 100% but the global process is still constrained. Rule: measure OEE where improvement directly affects total throughput.
Tell us about your plant. We'll tell you how we'd do it.
25 years applying Lean in real plants. Free diagnostic conversation.
Request demo See Lean Manufacturing