Extended Value Stream Mapping — your VSM is not badly drawn: it is out of date.
The classic VSM is a snapshot: it is drawn in a workshop with sticky notes, filled in with times estimated from memory, and obsolete within weeks. iLEAN's extended VSM is measured instead of estimated: every stage of the flow — supplier, receiving, process, shipping, customer — feeds the central memory with real times, inventories and waits, and the map recalculates itself. Kaizen attacks the waste the living map points at today, not the one in the six-month-old snapshot.
The VSM workshop goes well. The map left hanging on the wall is the problem.
The Value Stream Mapping workshop is among the best two days an operations team can spend. People who do not usually talk to each other get together, the flow is drawn on a wall, someone from logistics says out loud a wait production did not know existed, and the team walks out with a shared vision. None of that is wrong. The problem starts the following Monday, with the map already on the wall:
- The times are estimates, not measurements — cycle time is filled in from memory or with a stopwatch over a handful of parts: one good shift, with the veteran operator, no incidents. That number enters the map as if it were the year's average.
- Work-in-progress inventory is counted on a Tuesday — the WIP between stages is estimated from what happened to be in the plant that specific day. If Tuesday followed a stoppage, the map inherits a snapshot that represents nothing.
- Waits are systematically underestimated — everyone knows the process time; the time a part spends waiting between stages nobody measures, and it is usually the biggest share of the lead time.
- The map expires within weeks — the product mix changes, a new part number comes in, a machine is replaced, a supplier starts delivering late. At six months the map describes a plant that no longer exists, but it stays on the wall and keeps steering decisions.
- It stops at the plant gate — the workshop VSM draws from inbound dock to outbound dock. But a huge part of the lead time is outside: in the supplier's real delay and in the finished product's wait for the customer's loading window.
The familiar result: a twelve-action Kaizen plan prioritized on a snapshot. Three get executed, and by the time the effect is measured nobody can prove whether the lead time dropped because of those actions or because the workload dropped. The extended VSM does not replace the methodology: it removes its expiration date and adds the two missing ends.
The map stops being drawn and starts being calculated — from supplier to customer.
The idea of the extended VSM is simple to state: if every stage of the flow leaves a trace in some system, the map does not need to be drawn, it needs to be read. Connect is the putty that fills the cracks between the ERP, the MES, the SCADA, warehouse movements and the delivery notes coming in and going out; with that, the central memory rebuilds the complete flow and keeps it current on its own.
A workshop VSM tells you what your flow looked like the day you drew it. An extended VSM tells you what it is like today, where capital is sitting idle right now and which action frees up the most lead time this week.
The iLEAN pieces applied to the extended VSM:
- Connect — collects and unifies what already exists: orders and confirmations from the ERP, times and stoppages from the MES and the SCADA, warehouse movements, supplier shipping notices, inbound delivery notes, customer orders and delivery schedules. Most of the map is filled in here, without installing anything new.
- Edge — only where there is a real data gap: a manual stage with no record, a wait between stations nobody writes down, an intermediate buffer invisible to every system. It measures on the line and works without a network.
- Agents — the brain. They rebuild the flow stage by stage, separate process time from waiting time, quantify work in progress per segment, compare the supplier's real pace against the committed one, recalculate the map and rank waste by impact on lead time and tied-up capital.
- Three safety rings — the system proposes the prioritized list of Kaizen actions and their order of magnitude of return. What gets attacked, when and with what resources is decided by the team. The map points; the person decides and signs.
The five stages of the extended flow
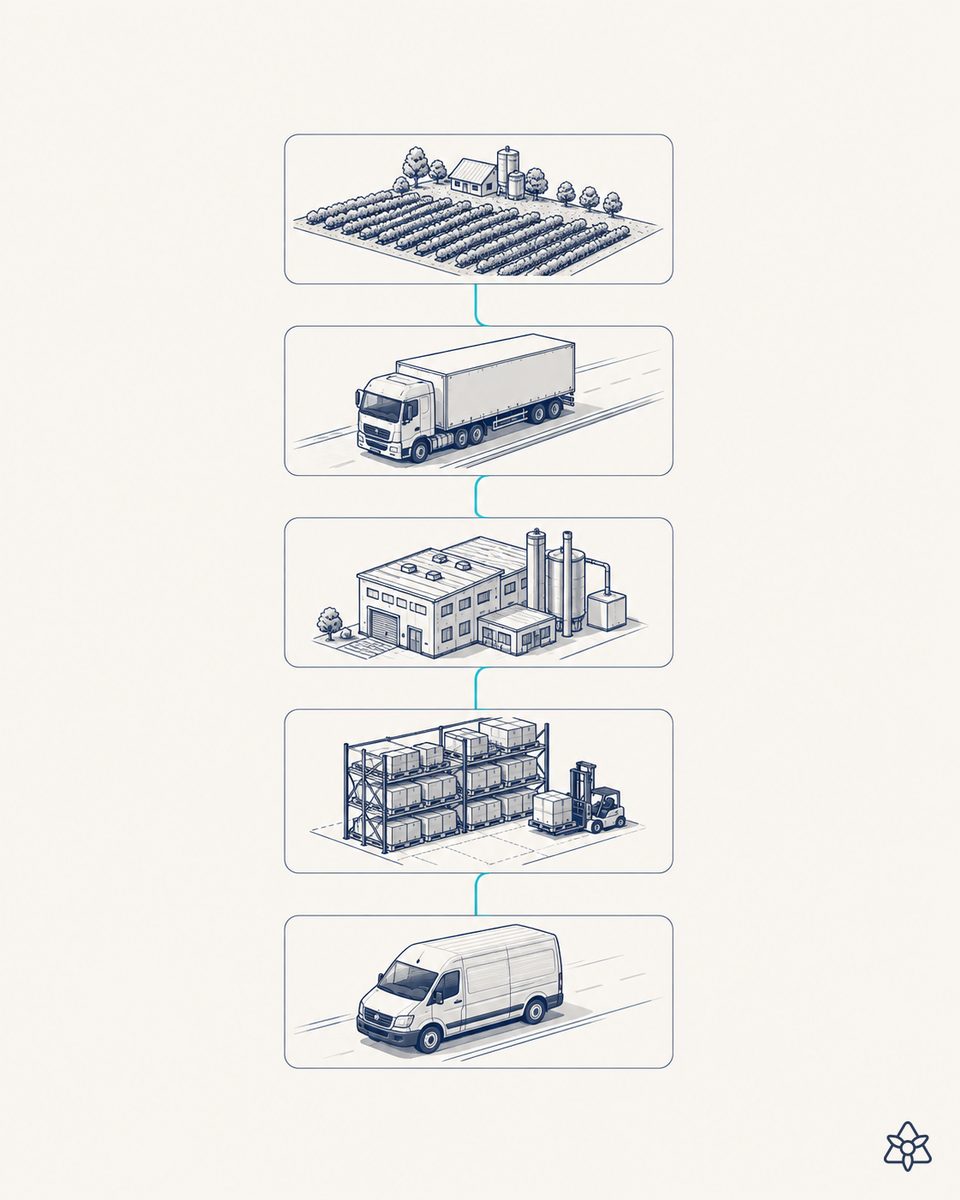
"Extended" means the map starts before the inbound dock and ends after the outbound one. What is measured in each segment:
| Flow stage | What is measured | Where the data comes from |
|---|---|---|
| Supplier | Real lead time from order to dock, variability of the committed date, quantity compliance | ERP orders, shipping notices, inbound delivery notes |
| Receiving | Wait at the dock, time until available in the warehouse, inbound quality incidents | Warehouse movements, receiving records, incoming inspection |
| Process | Real cycle time per part number, format changeovers, stoppages, work in progress between stations | MES, SCADA and PLCs; Edge where data is missing |
| Shipping | Finished product waiting for a loading window, preparation time, dock occupancy | Warehouse movements, outbound delivery notes, transport scheduling |
| Customer | Compliance with the committed date, demand variability against the schedule | Firm orders, delivery schedules, receiving confirmations |
Workshop VSM vs. extended VSM with iLEAN
| Aspect | Workshop VSM with sticky notes | Extended VSM with iLEAN |
|---|---|---|
| Source of the data | The team's memory and a one-off stopwatch | Continuous measurement of every stage |
| Scope | From inbound dock to outbound dock | From supplier to customer, with the data you already exchange |
| Shelf life | Weeks; then it describes a plant that has already changed | Permanent: it recalculates itself |
| Waiting time | Estimated, almost always on the low side | Measured segment by segment, including queues and buffers |
| Work-in-progress inventory | Counted on one specific day | Continuous series per flow segment |
| Kaizen prioritization | Room consensus over the snapshot | List ranked by measured impact on lead time and capital |
| Measuring the effect | The workshop is repeated months later, if at all | Automatic comparison against the previous version of the map |
| Maintenance effort | Two team days every time | None: the map maintains itself |
Impact estimate for your plant — to be validated with your numbers.
The block below is an estimate to be validated with the specific data of your plant. We set it out so the committee has an order of magnitude; we refine it during the diagnostic.
- Usual starting point: a VSM run in a workshop more than six months ago, end-to-end lead time of two to four weeks and a relevant share of working capital tied up in work in progress and finished product.
- Start with Connect over the systems you already have plus a few new measurement points where data is missing. First complete living map in a few weeks, not in a one-year project.
- Indicative payback between 4 and 9 months, via reduction of work-in-progress inventories and lead time. Those are the two levers the living map moves: less idle capital and less door-to-door time.
- It also removes the recurring cost of redoing the VSM workshop every season, and the drift produced by deciding on an expired map.
And the operations manager's reasonable doubt
“What if the AI makes up a segment of the map, or a time that isn't real?” — hallucination is a problem of free generation, not of anchored tasks. Rebuilding a value stream is exactly the opposite of free generation: every box on the map is calculated from time-stamped records — an order, a warehouse movement, a delivery note — and the result is a subtraction of dates, not an opinion. In this class of tasks the best models are below 1.5% error [1]. And every number on the map is traceable to the record that generated it: if a time does not add up, you open it and see where it comes from. The action list reaches the team as a ranked proposal, not as an executed decision.
[1] OpenAI paper “Why Language Models Hallucinate”, 2025 — on the reliability of AI in anchored tasks.
You may also be interested in: Digital VSM with real data · The 8 wastes detected with AI · JIT with a non-compatible supplier
What people ask about extended Value Stream Mapping
What exactly fails in the workshop VSM with sticky notes?
The method does not fail — the source of the data and the expiration date do. In a VSM workshop the flow is drawn on a wall with sticky notes, and cycle times, format changeovers and work-in-progress inventories are filled in from memory or with a one-off stopwatch: you measure one good shift, with the veteran operator and no incidents. That number enters the map as if it were the year's average. And the map gets hung up, photographed and left there: six weeks later the product mix, a supplier and a machine have changed, and the map already describes a plant that does not exist. The extended VSM does not change the grammar of VSM: it changes the fact that every box on the map is filled with what is measured and refills itself.
Where does the living map's data come from? Do we have to instrument the whole plant?
There is no need to instrument everything, and that is the point. Most of the map is filled with data that already exists and today is scattered: orders and confirmations from the ERP and the MES, signals from the SCADA and the PLCs, warehouse movements, inbound and outbound delivery notes. Connect collects and unifies them in the central memory. Edge is only added where there is a real data gap — a manual stage with no record, a wait between stations nobody writes down, an intermediate buffer that lives in no system. A typical living map starts with 70-80% of the flow covered by existing data and a few new measurement points. An estimate to be validated with your plant.
What does "extended" to supplier and customer mean? Do I have to integrate with their systems?
No. "Extended" means the map crosses the plant's walls using the data you already exchange with them: the supplier's shipping notice, the inbound delivery note, the customer's firm order, the delivery schedule, the receiving confirmation. With that you can already reconstruct what matters upstream and downstream: how long a supplier really takes from order to dock, how much variability that date injects into your safety stock, and how long your finished product sits in shipping waiting for a loading window. No access to third-party systems is requested: what they already send you is read, and their real pace is measured against the committed one.
How often is the map recalculated?
Data comes in continuously; the map is recalculated continuously for the operations view (cycle times, queues and work-in-progress inventories up to date) and consolidates a weekly or monthly reference version for improvement meetings and the committee. That double cadence matters: the daily view is for reacting, and the consolidated version is for comparing against the previous map and proving that a Kaizen action genuinely moved the lead time. Every version is stored, so the value stream's history stops being a folder of photos and becomes a time series.
How do you prioritize which waste to attack first?
The living map ranks waste by measured impact on lead time and on tied-up inventory, not by the intuition of whoever held the marker in the workshop. The agent calculates for each stage how much of the total time is value added and how much is waiting, transport, rework or overproduction, and estimates how much lead time and how much working capital closing each gap would free up. Out comes a ranked list with an order of magnitude of the return per action. The decision of what to attack and in what order remains the team's: the system proposes and ranks, the person chooses and signs.
More cases in lean manufacturing
- DMAIC: the structured Six Sigma improvement cycleiLEAN runs DMAIC with live data: every phase with its real metrics, no Six Sigma projects dying in…
- Dynamic takt time with AI — your line's rhythm, not last quarter's.How iLEAN recalculates takt time continuously from real demand, live OEE and shift availability —…
- Industrial ESG and CSRD reporting with AI — the report compiles itself, with the evidence behind every figure.iLEAN captures energy, water and waste data continuously, keeps ESG KPIs live per line and batch, and…
- Digital gemba and genchi genbutsu — go to the real place without leaving the place in the dark.Gemba at a distance without losing what matters: go to the real place, see the real thing. iLEAN lifts…
- Multi-product golden batch: every SKU has its perfect batch — and today it lives in the veteran operator's head.iLEAN identifies the real golden batch for each SKU and compares the running batch against it in real…
- Heijunka: production leveling with AI forecastingiLEAN levels your production with AI forecasting, optimal sequencing and balanced product mix. Heijunka…
Tell us about your case and within 48h we'll send you the estimated ROI of the extended VSM for your plant.
We work on your plant's real data, not ours. Diagnostic with no commitment.
Request estimated ROI in 48h See Lean Manufacturing