Industrial ESG and CSRD reporting with AI — the report compiles itself, with the evidence behind every figure.
The CSRD requires sustainability to be reported with verifiable data, and today the report gets assembled once a year by chasing energy, water and waste spreadsheets. With iLEAN, meters, reports and waste delivery notes are captured continuously (by integration or by photo), the central memory keeps the ESG KPIs live per line and per batch, and the CSRD report is compiled with traceable evidence. The person reviews and signs.
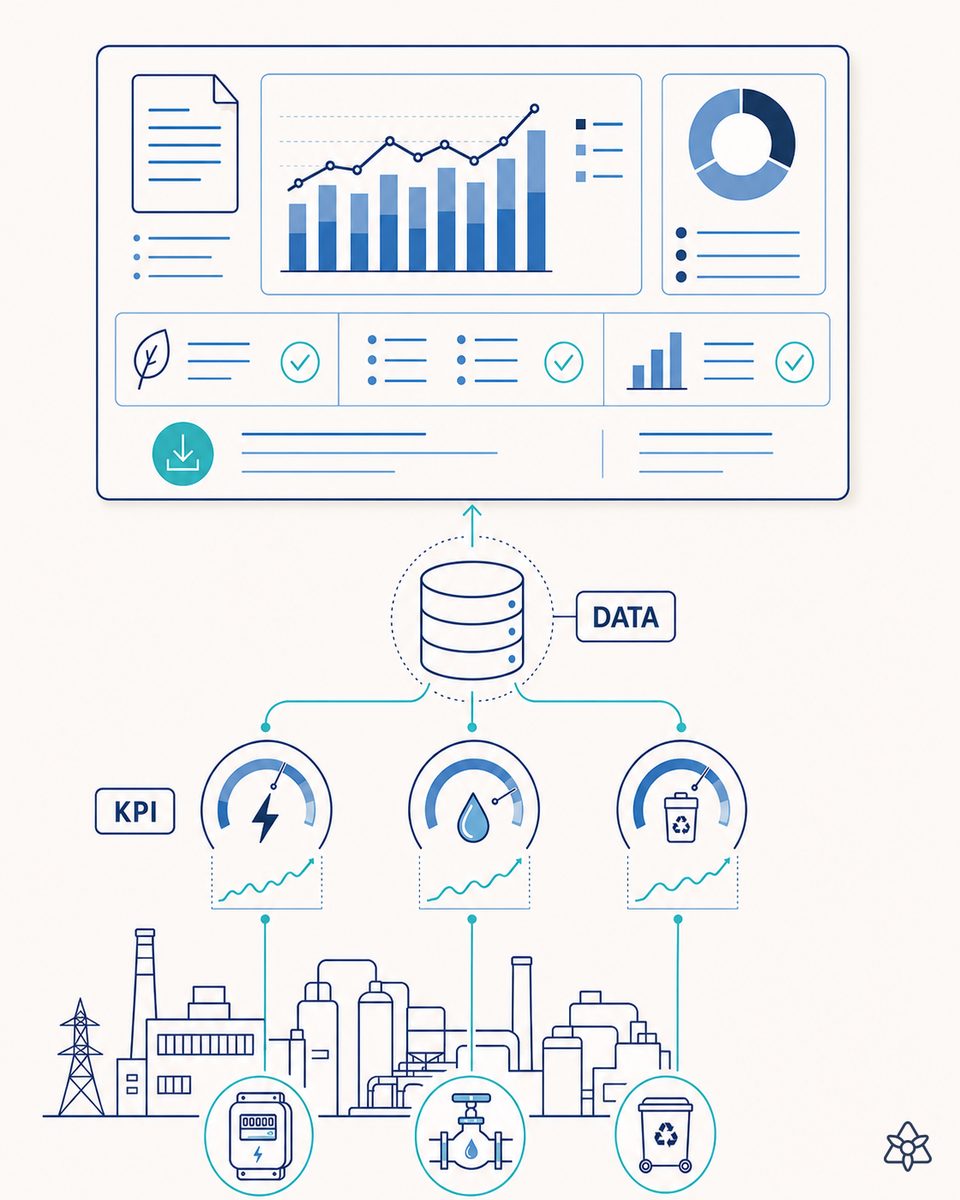
The sustainability report gets written in March with data no one saved in June.
Industrial ESG reporting does not fail for lack of will — it fails because the data is not preserved at the moment it is generated. The pattern repeats in almost every plant:
- Annual capture in scramble mode — someone from quality or environment spends weeks emailing maintenance, purchasing and outside contractors for consumption figures, invoices and delivery notes.
- Data that only exists on paper — the well meter is read by hand into a notebook, the waste delivery note is filed in a folder, the contractor's scale prints a ticket no one digitizes.
- Aggregates with no breakdown — the whole plant's consumption is reported because there is no way to split it by line or by product. And without that breakdown you cannot calculate intensity per unit produced or know where the energy is going.
- Traceability reconstructed after the fact — when the assurance provider asks where a figure comes from, the path has to be retraced backwards. Sometimes it is found; sometimes it is estimated and noted as an estimate.
While reporting was voluntary, the system held up. With the CSRD the bar changes: sustainability information is subject to external assurance, just like financial information. And a data point that cannot be traced to its origin stops being reportable.
iLEAN does not write your report — it keeps alive the data bookkeeping the report is written from.
ESG reporting is, at heart, an operational memory problem: in January you need to know what happened in June, in enough detail to explain it. iLEAN provides exactly that — continuous capture, central memory and assisted compilation. Connect is the putty that fills the cracks between the ERP, the SCADA, the lab's spreadsheet, the waste contractor's delivery note and the meter that can only be read by looking at it.
The sustainability lead stops chasing data and starts reviewing a report that already exists. What used to be weeks of collection becomes hours of judgment.
The iLEAN pieces applied to CSRD reporting:
- Edge — captures on the floor what has no signal: meter readings by photo, scale tickets, waste delivery notes, consumption reports signed on the phone. It works without a network.
- Connect — integrates what does have one: power analyzers, flow meters, gas meters, ERP, MES and SCADA. It joins consumption to the production order, and that is where intensity per line and per batch appears.
- Agents — keep the ESG KPIs live, apply the declared conversion factors, flag gaps and consumption deviations against the line's usual pattern, and compile the report draft with every figure linked to its evidence.
- Three safety rings — no figure is published on its own. The agent proposes the value and its origin; the sustainability lead reviews, corrects and signs. Responsibility for the report stays with the person.
Annual ESG reporting in spreadsheets vs. continuous CSRD reporting with iLEAN
| Aspect | Classic annual ESG reporting | Continuous CSRD reporting with iLEAN |
|---|---|---|
| Capture frequency | Once a year, in campaign mode | Continuous, at the moment the data is generated |
| Data origin | Emails, invoices, notebooks and paper delivery notes | Direct integration where there is a signal, photo where there is none |
| Granularity | Plant-wide aggregate | Per line, per shift and per batch |
| Evidence for the assurance provider | Reconstructed backwards when requested | Linked to each KPI from the moment of capture |
| Conversion factors | In the spreadsheet of whoever builds the report | Declared and versioned, reproducible recalculation |
| A customer's ESG questionnaire | Weeks of collection from scratch | Days: proposed draft with evidence, the person adjusts |
| Energy or water overconsumption | Detected at year-end close, if seen at all | Detected when it happens, against the line's usual pattern |
| Reporting hours recovered | — | Substantial reduction in collection effort (estimate to be validated) |
Impact estimate for your plant — to be validated with your numbers.
The block below is an estimate to be validated with the specific data of your plant. We set it out so the committee has an order of magnitude; we refine it during the diagnostic.
- Plant that today assembles the report once a year, collecting energy, water and waste consumption from spreadsheets, invoices and paper delivery notes.
- Edge + Connect deployment on the relevant measurement points (energy, water, gas, waste) plus integration with ERP and MES. First set of live KPIs within a few weeks.
- Indicative payback between 6 and 12 months, from two levers: reporting hours recovered (internal and external consulting) and detection of overconsumption that today goes unnoticed until the close.
- Response time to a customer's ESG questionnaire going from weeks to days, with the evidence already attached to each answer.
And the sustainability lead's reasonable doubt
“What if the AI makes up a figure in a report that goes to external assurance?” — hallucination is a problem of free generation, not of anchored tasks. Reading a meter in a photo, extracting the code and weight from a delivery note or applying a declared conversion factor to a measured consumption are anchored tasks: there is a document, there is a data point and there is a formula. On this kind of task the best models are below 1.5% error [1]. And even so, no figure is published without the responsible person reviewing it against its evidence and signing it. The three safety rings are there precisely for this.
[1] OpenAI paper “Why Language Models Hallucinate”, 2025 — on the reliability of AI in anchored tasks.
You may also be interested in: ISO 9001 with continuous audit and AI · Compressed-air optimization with AI · ISO 45001 and occupational health and safety with AI
What people ask about industrial ESG and CSRD reporting with AI
What exactly does the CSRD require from an industrial plant?
The CSRD, and the ESRS standards that develop it, require sustainability information to be reported with the same discipline as financial information: traceable data, declared methodology and external assurance. For a plant, that translates into energy and water consumption, energy mix, scope 1 and 2 emissions, waste by code and destination, and their intensity per unit produced. The difference from the voluntary report of the past is that now you must be able to show where every figure comes from — the spreadsheet reconstructed in March does not survive that question.
How is energy, water and waste data captured without typing anything?
Through two routes that coexist. Where there is a signal, Connect reads it directly: power analyzers, flow meters, gas meters, the SCADA, the ERP. Where there is none — the old well meter, the waste contractor's scale, the paper delivery note the driver leaves behind — the operator takes a photo from their phone and the agent extracts the reading, the date and the waste code, and logs it against the corresponding line and shift. No one transcribes figures into a spreadsheet.
How do you guarantee the data is verifiable and survives an audit?
Every ESG KPI keeps its chain of evidence: the published value, the origin (meter reading, delivery note, ERP record), the original document or photo, the moment of capture, the formula applied and who reviewed it. The auditor does not receive a loose figure: they open the KPI and drill down to the delivery note. And the conversions (emission factors, densities, equivalences) are declared with their version, so recalculating the previous year is reproducible. The agent compiles; the person reviews and signs.
Does it also cover the ESG questionnaires our customers send us?
Yes, and it is usually the first visible return. Customer questionnaires, and those from supplier-rating platforms, almost always ask for the same quantities as the CSRD in a different format and on a different calendar. Because the central memory keeps the KPIs live, answering stops being a two-month project and becomes a review of days: the agent proposes the answer with its associated evidence, and the responsible person adjusts the nuance and sends it.
We have several plants in different countries. How does it work multi-site?
Each plant captures locally with its own meters, its units and its language, and consolidates upward with the declared conversions. The agent normalizes before adding (units, per-country emission factors, different calendars) and flags the gaps: which plant has not closed the month and which data point is missing before consolidation is possible. The group sees the aggregate and each plant keeps its detail — without anyone having to pull together twelve spreadsheets with different structures.
More cases in lean manufacturing
- Plant digital twin with AI — the twin does not start with the 3D model, it starts with the information existing.The useful digital twin does not start with 3D: iLEAN builds the informational twin of your plant with…
- DMAIC: the structured Six Sigma improvement cycleiLEAN runs DMAIC with live data: every phase with its real metrics, no Six Sigma projects dying in…
- Dynamic takt time with AI — your line's rhythm, not last quarter's.How iLEAN recalculates takt time continuously from real demand, live OEE and shift availability —…
- Extended Value Stream Mapping — your VSM is not badly drawn: it is out of date.The VSM stops being a snapshot: iLEAN measures real times, inventories and waits from supplier to…
- Digital gemba and genchi genbutsu — go to the real place without leaving the place in the dark.Gemba at a distance without losing what matters: go to the real place, see the real thing. iLEAN lifts…
- Multi-product golden batch: every SKU has its perfect batch — and today it lives in the veteran operator's head.iLEAN identifies the real golden batch for each SKU and compares the running batch against it in real…
Tell us about your case and within 48h we'll send you the estimated ROI of continuous CSRD reporting for your plant.
We work on your plant's real data, not on ours. Diagnostic with no commitment.
Request estimated ROI in 48h ‹ See all Lean methods