The resin dryer and the high pressure compressor start talking
A PET packaging plant has two assets that govern everything else and are almost never connected: the resin dryer and crystalliser, which governs quality, and the high pressure compressor, which governs the electricity bill. Both display everything you would need to know on their panel, and both forget it every time the screen cycles. With iLEAN Connect, one external camera pointing at the panel is enough: the equipment stays exactly as it is, but the plant gains a digitized time series it can correlate batch by batch.
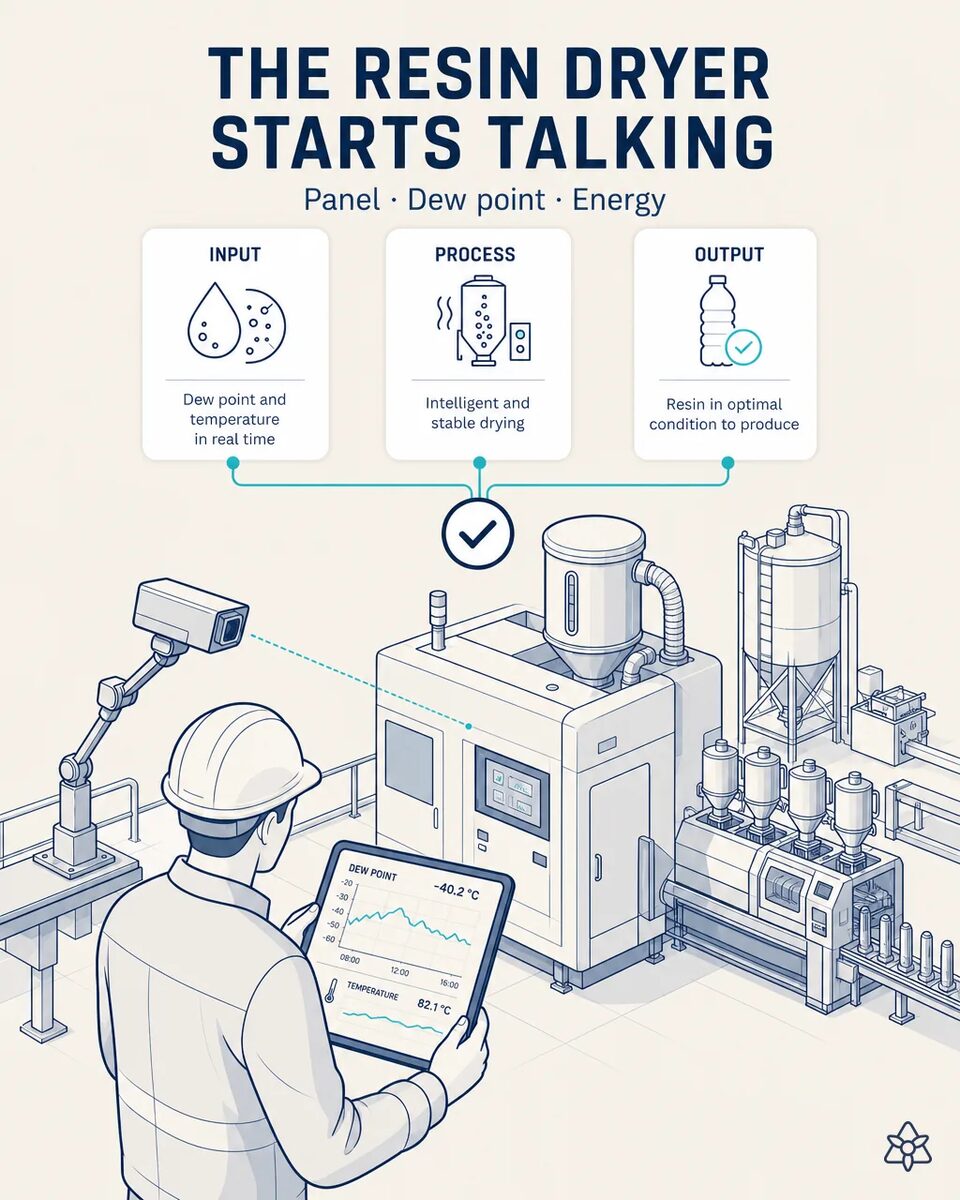
Two assets govern everything else, and neither is connected.
If resin reaches the screw above its target moisture, intrinsic viscosity drops during processing and the preform comes out brittle. You do not see that on the line: it surfaces three days later in a lab test or — worse — in a complaint from the bottler, when the bottle fails on their filler. The dryer panel shows dew point, hopper temperature, air flow and desiccant wheel hours. The compressor panel shows pressure and consumption. All the information you need is right there, and all of it dies on the panel. Nobody today can correlate drying conditions with breakage, or blow pressure with kilowatts per thousand units. The classic alternative — replacing the equipment with a connected one — is a CAPEX nobody signs off purely to obtain data, and it means line downtime on top. So the plant lives with the blind spot.
- The dryer-crystallizer governs quality. The high pressure compressor governs the electricity bill. Both show on their panels everything you would need to know.
- If resin reaches the screw above its target moisture, intrinsic viscosity drops during processing and the preform comes out brittle. That is not visible on the line.
- It surfaces three days later in a laboratory test or — worse — in a bottler's complaint, when the bottle bursts in their filler.
- Dew point, hopper temperature, air flow, desiccant wheel hours, pressure and consumption: all the information needed is there, and all of it dies on the panel.
Connect in photo mode on the panel — no PLC, no open ports, no lost warranty.
Connect, photo-on-panel mode. A fixed industrial camera pointed at the screen, without touching the equipment. Step by step:
Nothing on the machine gets touched, and that answers the objection that blocks most of these projects: no port is opened, nothing is installed on the control system and the manufacturer's warranty stands.
- Capture. The camera images the panel every few seconds, including screens that cycle.
- Reading. OCR with a grounded language model interprets each frame and structures the values: dew point, hopper temperature, air flow, desiccant wheel hours; pressure and consumption on the compressor.
- Time series. The values become a continuous series in central memory, with no PLC, no open ports and no compromise to the manufacturer's warranty.
- Cross-reference. Matched against the ERP or MES to know which batch and which mold were running at each moment.
- Correlation. What cannot be seen today appears: drying conditions against intrinsic viscosity and breakage; pressure and consumption against the reference being produced.
The same pattern transfers directly to any other isolated asset in the plant: chiller, cooling tower, regrind mill or the panel of the oldest injection machine.
Today's panel versus the panel being read
| Aspect | Today | With iLEAN Connect |
|---|---|---|
| Panel data | Dies when the screen rotates | Continuous, queryable time series |
| Root cause of a bad batch | Done from memory | Resolved in minutes with the curve |
| Drying ↔ viscosity ↔ burst correlation | Impossible | Direct, batch by batch |
| Compressor consumption | Shows up on the bill | Attributable to batch and mold |
| PLC and ports | — | Untouched |
| Manufacturer's warranty | — | Intact |
Estimated impact — to validate with your own numbers.
The block below is an estimate to be validated against your plant's actual data. We put it forward so the committee has an order of magnitude; we refine it during the assessment.
- Estimated payback 5-10 months, plus the replacement capex that gets deferred.
- Less scrap from brittle preforms, through the drying ↔ viscosity ↔ burst correlation that cannot be made today.
- Attributable energy savings on the plant's largest consumer.
- Root cause analysis of a bad batch in minutes, with the curve in front of you, instead of from memory.
Estimated payback 5-10 months, plus the replacement CAPEX you defer. Two sources of return: less scrap from brittle preforms (drying ↔ viscosity ↔ breakage correlation) and attributable energy savings on the hall's largest consumer. In a continuous process plant, the energy saving alone usually carries the case. *Estimate to be validated.*
And the fair question from the production manager
«Does a camera watching a panel hold up as technical evidence?» — here the task is anchored: fixed screen, fields in known positions and expected physical ranges, where the best models drop below 1.5% error [1]. On top of that, the system discards any frame whose value falls outside the physically possible range instead of accepting it, which is what would invalidate the series.
[1] OpenAI paper "Why Language Models Hallucinate", 2025 — on the reliability of AI in anchored tasks.
What people ask about reading the dryer panel
Do we have to open the dryer's PLC?
No, and that is the point. The camera looks at the panel from outside: no connection to the control system, no ports opened and nothing installed on the machine, so the manufacturer's warranty is unaffected.
Does it work for the high pressure compressor too?
Yes, and it is worth doing both at once: it is the plant's largest energy consumer and its panel is just as accessible. The energy return adds to the quality one.
How often does it capture?
Every few seconds, including screens that rotate. The cadence is set at commissioning to how long the panel takes to cycle through.
Can it be crossed with the batch running at the time?
Yes, and that is half the value: it is crossed with the ERP or MES to know which batch and which mold were running at each point of the curve.
How much history is needed?
To investigate a specific batch, having it captured. To detect desiccant wheel drift, some weeks — the time the trend takes to draw itself.
More cases from this series
- The audit is always ready, with nothing rebuilt by handEvery critical change and every batch generates its evidence. Agents organises it by standard and…
- Zero grams lost: the resin balance, live, from silo to palletFour coordinated rings close the balance between resin kilos entering through the silo and thousands of…
- The blow molder start-up recipe, captured in one photoThe blow molder set-up sheet, captured by photo: the batch's real recipe enters the system at second…
- The order changes by email and the plan rebuilds itselfiLEAN reads the schedule-change email or WhatsApp, cross-checks it against the live plan and silo…
- The shift lead dictates without stopping his walk through the plantThe shift lead dictates issues while walking between injection and blow molding. iLEAN structures each…
- The PET lab reaches the ERP without a single retyped figureiLEAN reads the PET test sheet as it is saved and, after validation, posts it to the ERP. Typical 50-80%…
Tell us whether you can correlate a brittle preform with drying conditions today.
We work on your plant's real data, not ours. Assessment with no commitment.
Request estimated ROI within 48h ‹ See all cases of PET packaging See packaging