Digitizing the concentrate evaporator panel without touching the machine
The evaporator in a citrus plant is the most expensive asset of the season and is typically fifteen to twenty-five years old. Its panel shows degrees Brix, temperature per effect, vacuum, feed flow and alarms, and cycles screens every few minutes. Replacing it means a seven-figure CAPEX and a season of downtime. With an external camera pointed at the panel, iLEAN Connect digitizes the concentration curve batch by batch without touching the control logic or exposing the machine to the network.
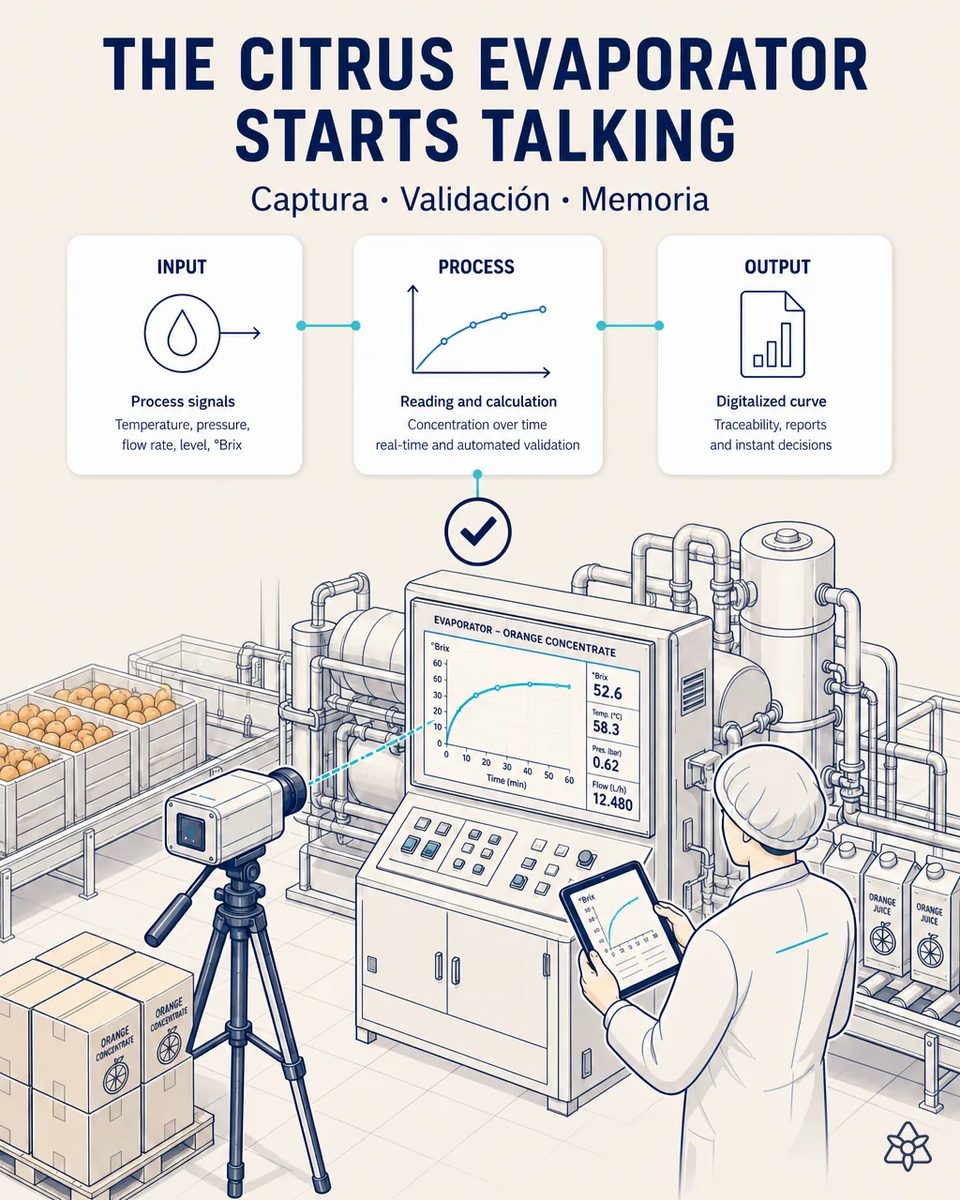
The most expensive asset of the season keeps its data on a screen that cycles.
The orange season is intensive and seasonal: a few weeks a year in which the plant runs at its limit and in which every point of yield is multiplied by thousands of metric tons. When concentrate yield drops, the question is always the same: was it the fruit, the evaporator setting or the extraction? Nobody can answer it with data, because the panel data dies every time the screen cycles. The correlation between the fruit that came in that morning, the process applied and the gallons that came out never gets made. Decisions run on experience, which in these plants is enormous, but experience leaves no record you can study next season or hand over to a successor. And the obvious alternative — replacing the evaporator with a modern one with an open SCADA — is not an alternative: it is a major investment project with a shutdown the season will not tolerate.
- The evaporator is fifteen to twenty-five years old, isolated from the network by design, and its panel shows outlet degrees Brix, temperature per effect, vacuum, feed flow and alarms — for a few minutes, until the next screen takes over.
- When gallons of concentrate per metric ton of fruit drop, the question is always the same: was it the fruit, the evaporator setting or the extraction? Nobody can answer it with data, because the panel data no longer exists.
- The season is a few weeks a year in which every point of yield is multiplied by thousands of metric tons. The decision runs on experience, which is enormous, but which leaves no record to study next season or hand over to a successor.
- And the obvious alternative — a modern evaporator with an open SCADA — is a seven-figure CAPEX and a shutdown the season cannot absorb.
Connect in photo mode on the panel — solved from outside, not inside.
Connect in "photo of the analog" mode applied to machine panels. The flow:
It does not connect to the evaporator, does not touch its control logic and does not compromise its warranty. On the machine the whole season depends on, that is the difference between a case the plant manager approves this week and a project nobody dares to schedule between two campaigns. The machine is still the same machine; the plant simply keeps what it was already saying — and next season starts with a curve to compare against instead of a memory.
- A fixed industrial camera points at the panel screen. Nothing is connected to the equipment, its control logic is untouched and its warranty is not compromised.
- OCR with a grounded language model reads each frame and recognizes the panel's fields, even as the screen cycles between different views.
- The full time series is rebuilt: outlet degrees Brix, temperature per effect, vacuum level, feed flow and alarms.
- The series is cross-referenced with the fruit batch in process (from the ERP or the intake weighbridge) and with the lab's Brix reading.
- The concentration curve becomes queryable by batch, season after season.
The evaporator is still the same evaporator. The only change is that the plant now keeps what the machine was already saying.
Today's evaporator versus the evaporator being read
| Aspect | Today | With iLEAN Connect |
|---|---|---|
| Brix, temperature per effect, vacuum | On screen for minutes, then gone | Full time series, batch by batch |
| Correlation with the fruit batch | Never made | Cross-referenced with the weighbridge and the lab |
| Yield drop mid-season | Argued from experience | Root cause in minutes |
| Concentration curve from last season | Does not exist | Queryable, season after season |
| The evaporator's control logic | — | Untouched, no network exposure |
| Replacement CAPEX | Back in the plan every year | Deferrable, with the machine under control |
from zero correlation between evaporation curve and yield, to root-cause analysis by fruit batch in minutes. From an equipment replacement that appears in the investment plan every year, to a sustainable deferral with the machine under control.
Estimated impact — to validate with your own numbers.
The block below is an estimate to be validated against your plant's actual data. We put it forward so the committee has an order of magnitude; we refine it during the assessment.
- Estimated payback 5-10 months.
- The larger component is not operational: it is deferring a replacement CAPEX of a far higher order, sustainably, because the machine is finally under control.
- Plus percentage points of improvement in gallons of concentrate per metric ton of fruit, through tuning based on data instead of memory.
- And a concentration history that survives the season and the people, which is what a successor inherits today as nothing at all.
estimated payback 5 to 10 months. The larger component is not operational: it is deferring a replacement CAPEX of a far higher order, plus percentage points of improvement in gallons of concentrate per metric ton of fruit through data-based tuning. *Estimate to validate.*
And the fair question from the production manager
«Can a camera reading a cycling screen produce a series you would trust?» — here the task is anchored: a fixed panel, fields in known positions and physical ranges known in advance, where the best models drop below 1.5% error [1]. And the system discards any frame whose value falls outside the possible range — Brix does not jump twenty points between two frames — instead of accepting it, which is what would corrupt the curve.
[1] OpenAI paper "Why Language Models Hallucinate", 2025 — on the reliability of AI in anchored tasks.
What people ask about reading the evaporator panel
Does anything get installed on the evaporator?
Nothing. A fixed industrial camera is mounted in front of the panel and that is all. No cable enters the machine, no port is opened and the manufacturer's warranty is not affected.
Does it cope with the panel cycling between screens?
Yes, that is the design condition. The model recognizes which view is on screen and reads the fields of each one, so the full series is rebuilt even though no single screen shows everything at once.
How is the curve linked to the fruit?
Through the batch in process, taken from the ERP or the intake weighbridge, and through the lab's own Brix reading. That cross-reference is what turns a curve into a root cause.
Does it work outside the citrus season?
The same pattern reads any isolated panel in the plant — the sterilizer, a homogenizer, a pasteurizer on the milk side — with the same camera approach and no change to the machine. You start with the evaporator because that is where the season's money sits, and the camera moves or multiplies afterwards.
Does this replace the plan to buy a new evaporator?
It defers it. Once the machine is under control with data, the replacement stops being urgent and becomes a decision you take when it suits you, not when the season forces it. The investment plan stops carrying the same seven-figure line every year by default.
More cases from this series
- Audit evidence exists before the inspector asks for itEvery critical changeover generates its dossier with before and after photos, log and signature, ordered…
- Bulk orange and aseptic input intake, without typing into the ERPPhoto the delivery note, the weighbridge ticket and the pallet labels; one-tap validation and straight…
- The shift lead's knowledge stops dying at end of shiftAn earpiece and voice: the shift lead dictates what they see without breaking stride, and gets support…
- Lab analysis reaches the ERP without anyone typing itiLEAN reads the lab sheet when it is saved, structures it and posts it to the ERP after validation. From…
- Milk collection alerts, read at second zeroThe carrier's message is cross-checked against the process plan and returns a concrete action, not a…
- The human gate sits before the silo, not after the complaintInhibitors, weighbridge, temperature and freezing point on one bay screen. The human signs and only then…
Tell us which critical machine in your plant has a panel nobody reads.
We work on your plant's real data, not ours. Assessment with no commitment.
Request estimated ROI within 48h ‹ See all cases of dairy and citrus See food industry