OEE on a multi-model car line — one aggregate number does not tell you where productivity is leaking.
A multi-model line switches SKU every 5-10 minutes: three models, two shifts, dozens of micro-changeovers. iLEAN measures OEE in real time and breaks it down by model, shift and changeover — it does not hand you a single percentage, it hands you the loss breakdown so that every action attacks the biggest one, not the most visible one. The person decides what to optimize.
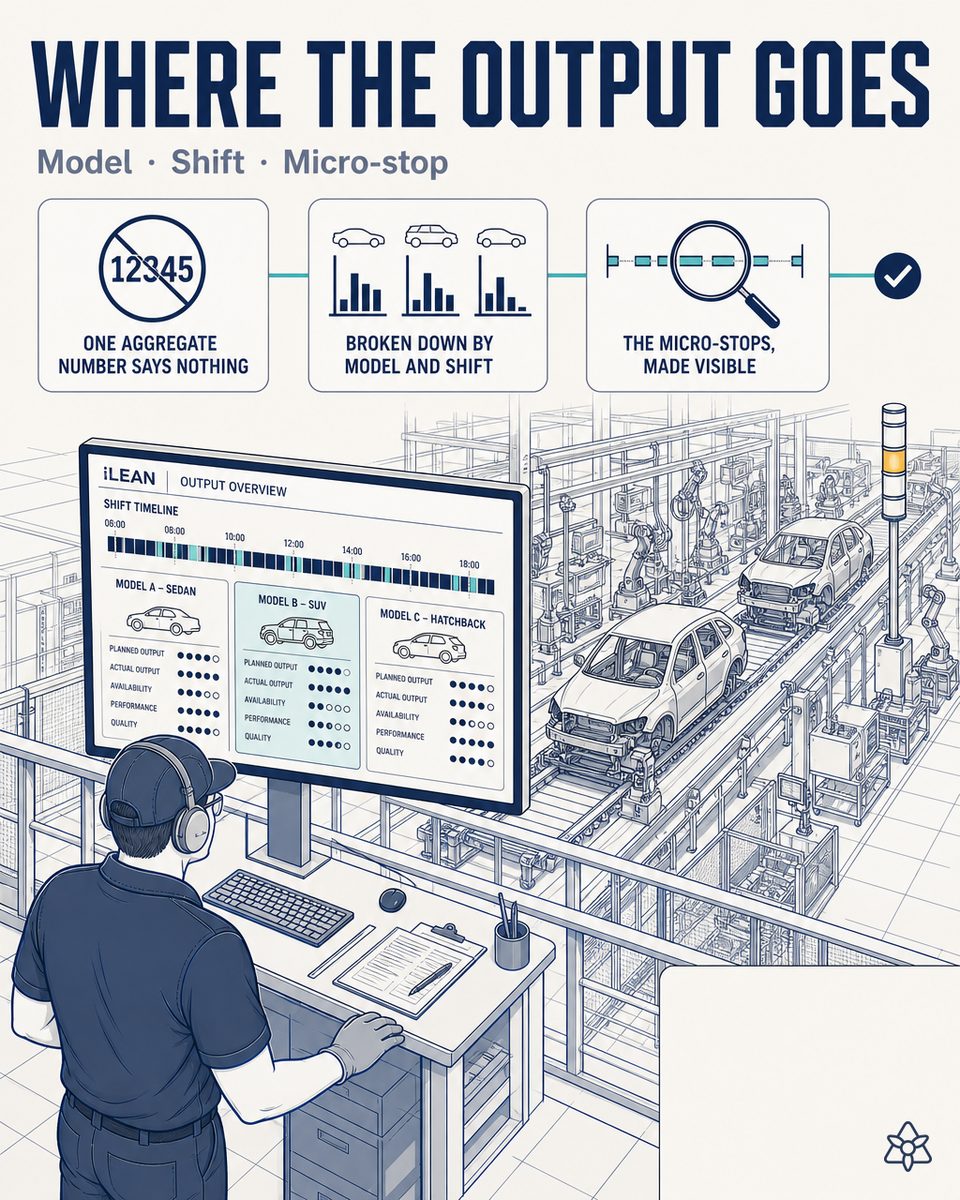
Aggregate OEE is a headline; the losses live in the detail.
On an assembly line building three or more models in the mix, the aggregate OEE the SCADA reports usually lands on a number nobody argues with (72%, 78%, 81%) and nobody knows how to attack. The problem is that that number averages three very different realities:
- Model A — the high-volume one, optimized over years, with high OEE.
- Model B — the new member of the family, with odd micro-stoppages at station 5 that the process team has not yet pinned down.
- Model C — the low-volume one, where every changeover takes forever and the changeover from B to C costs three times what the changeover from A to B costs.
When the plant manager asks “why did OEE drop on Tuesday?”, nobody has the answer. And when an improvement action is decided, the most visible thing gets attacked (a robot breakdown that stuck in the shift lead's mind) instead of the biggest loss (the extra 11 minutes on the B-to-C micro-changeover, repeated six times a shift, in silence). The SCADA and the MES do have the data — but they do not break it down, they do not tie it to the specific model and they do not cross-reference the changeover event with the loss in units. That breakdown gets done by hand in a spreadsheet on Monday mornings, and that spreadsheet always arrives too late.
iLEAN does not replace the SCADA — it breaks down what the SCADA aggregates.
The problem is not a lack of data; it is that SCADA data, MES data, VIN reader data and changeover process data live on separate islands and get averaged into a single figure you cannot decide from. iLEAN acts as the putty that fills that gap with a real-time calculation cross-referencing all four sources and returning an OEE broken down by model, shift and changeover.
Edge sees the line unit by unit. Connect reads SCADA, MES and ERP. The Brain calculates OEE by model, shift and changeover. The agent proposes to the production manager what to optimize first. The person decides — never the other way round.
The three iLEAN pieces applied to multi-model OEE:
- Edge — a terminal with vision over the line that identifies the model physically at each station and measures the real time of every micro-changeover (how much was theoretical, how much was adjustment, how much was waiting, how much was a defective first part). It works with no network — the calculation keeps running locally if the plant loses WiFi.
- Connect — reads SCADA / MES / PLC / ERP over OPC UA or an intermediate integration, captures stoppages and their reasons from the HMI, and captures what arrives from outside (a supplier alert delaying a specific part for model C) at second zero, with no forwarding chains.
- Agents + Brain — they calculate OEE in real time, break it down by model, shift and changeover type, identify the biggest loss of the period and propose to the production manager where to attack. They generate an automatic report for the weekly meeting and a per-shift dossier. The person signs the actions — iLEAN does not touch SCADA parameters on its own.
Aggregate SCADA OEE vs. OEE broken down with iLEAN
| Aspect | SCADA + the Monday spreadsheet | With iLEAN Edge + Connect + Brain + Agents |
|---|---|---|
| Granularity | Aggregate OEE by line and shift | OEE by model + shift + changeover + station |
| Micro-changeovers | Averaged out, invisible | Timed station by station, broken down |
| Root cause of the drop | “We don't know” or gut feel | The biggest loss of the period, with evidence |
| “Unassignable” losses | A big catch-all bucket | Reassigned by the agent to their real cause |
| Reporting speed | Monday morning | Real time, dashboard + automatic report |
| Operation with no network | n/a | Edge keeps measuring and recording locally |
Impact estimate for your plant — to be validated with your numbers.
The block below is an estimate to be validated with the specific data of your plant. We put it forward so the committee has an order of magnitude; we refine it during the immersion diagnostic.
- Assembly line with 2-4 models in the mix, 5-12 changeovers per shift, a working SCADA / MES, and current OEE between 65% and 82% depending on the plant.
- An Edge + Connect pilot on a section of 4-6 critical stations. First value expected within a few weeks: an OEE breakdown by model and by changeover published on a dashboard and actionable by the production manager.
- Indicative payback between 4 and 9 months, depending on production volume, unit value and the share of losses classified today as “unassignable”.
- Hard lever: a ≥ 30% recovery of the losses that are “unassignable” today, reassigned to their real cause (estimate to be validated). Once the real cause is attacked, the lever lands on the specific model and it shows up in units per shift.
The historical argument for the board — and the CAIO's reasonable doubt
Between 2000 and 2021, the least digitalized sectors barely improved productivity; the most digitalized raised it by up to 40% [1]. In automotive, the multi-model line is the place where digitalization pays off first — and broken-down OEE is the first decision tool that makes it tangible. The CAIO's reasonable doubt (“what if the agent reassigns a loss wrongly?”) is defused: the AI here invents nothing — it reclassifies data that already exists using context that already exists. In tasks anchored to the source, the best models bring error below 1.5% [2]. And even so, what is critical is not decided alone: iLEAN proposes the improvement action, the production manager signs it.
[1] Digitalization and productivity — Fundación BBVA / Ivie, sectors 2000-2021.
[2] OpenAI paper “Why Language Models Hallucinate”, 2025 — on the reliability of AI in anchored tasks.
What people ask about multi-model OEE in automotive
How does iLEAN separate losses by model on a mixed line?
By combining two signals. The first is the MES / SCADA data: which model entered each station and at what time. The second is Edge with vision over the line: a CNN identifies the model physically (shape, color, visible part variant) as a redundant check. The agent cross-references both, assigns every minute and every unit to its model, and breaks total OEE down into OEE-per-model. The result: when the plant manager asks “why did OEE drop on Tuesday?” the answer is not “it dropped” — it is “it dropped because model X had 17 more micro-stoppages than normal on the afternoon shift, and here is the log of the causes”.
What about micro-changeovers (a few minutes each)?
Micro-changeovers are the silent thief of OEE on multi-model lines. A nominal 8-minute changeover that is really 11 because station 4 takes longer, repeated every hour, adds up to whole shifts lost per month. iLEAN Edge measures the real time of every micro-changeover station by station and the agent breaks it down: how much is theoretical, how much is operator adjustment, how much is waiting on the previous station, how much is a defect on the first part after the changeover. The production manager no longer argues about “a feeling” — they see the breakdown.
Does it replace our current SCADA?
No. iLEAN is putty, not demolition. The SCADA stays where it is, doing what it does well (equipment control and supervision). iLEAN Connect reads from the SCADA / MES over OPC UA or through an intermediate integration (just as it does from the PLC, the ERP and the VIN reader) and builds a multi-model OEE calculation and a loss breakdown on top, which the SCADA typically does not do. Nothing is duplicated — the gap between the SCADA's raw data and the plant manager's decision is filled in.
Does it work in a brownfield plant with heterogeneous lines?
Yes — that is where it pays off most. In a greenfield plant multi-model OEE can be designed in from the start; in brownfield the reality is stations from three different generations (a modern PLC + a 20-year-old PLC + a semi-manual machine). We grade iLEAN Connect across three levels depending on the station: direct integration where there is a modern protocol, intermediate screen reading where there is an old local computer, and vision capture / operator dictation where there is nothing at all. The result: unified OEE without asking you to change the line.
How much can OEE go up on a multi-model line?
The headline number depends on where you start — a line at 65% has far more room than one at 85%. iLEAN's key lever is not “raising OEE” in the abstract: it is breaking losses down by root cause (model, shift, micro-changeover, first-part defect, waiting on an internal supplier…) so that every improvement action attacks the biggest loss and not the most visible one. A reasonable order of magnitude to put in front of the committee is a ≥ 30% recovery of the losses classified today as “unassignable” in the first year (estimate to be validated against your history). That recovery, paid out in units per shift, is the pilot's ROI.
More cases in automotive
- Kaizen with AI suggestions in automotive — the operator suggests through their own channel, the Agent prioritizes.iLEAN Connect captures the operator's suggestion by voice, photo or WhatsApp, and the agent prioritizes…
- LED headlamp control with AI — the OEM does not send back one unit, it sends back the whole batch.iLEAN applies Edge vision to LED headlamps — beam uniformity, scatter, color and micro-cracks in the…
- Lithium battery recycling control with AI — a damaged cell that reaches shredding still charged is the plant's nightmare; sorting it by eye is a gamble.iLEAN identifies every pack at intake, detects visible damage, diverts anything unsafe to quarantine and…
- Multifunction steering wheel control with AI — five worlds in a single part, and no cross-check in time.iLEAN combines Edge vision on the multifunction steering wheel, an electrical test of every button and…
- Multipack fastener control with AI — one screw missing from the kit is a phone call from the customer.How iLEAN counts and verifies every screw in the multipack kit in line with Edge vision and agents —…
- OEM CSR digitized with AI — your customer publishes a new revision, nobody reads it end to end, and finding the gap at the audit is too late.iLEAN digitizes every OEM's CSR: it extracts requirements from the PDFs, cross-checks them against your…
Tell us your case and in 48h we'll send you the estimated ROI of this AI project for your multi-model line.
We work on your plant's real data, not ours. Diagnostic with no commitment.
Request estimated ROI in 48h See automotive