The surfacing shift report stops dying in a tray
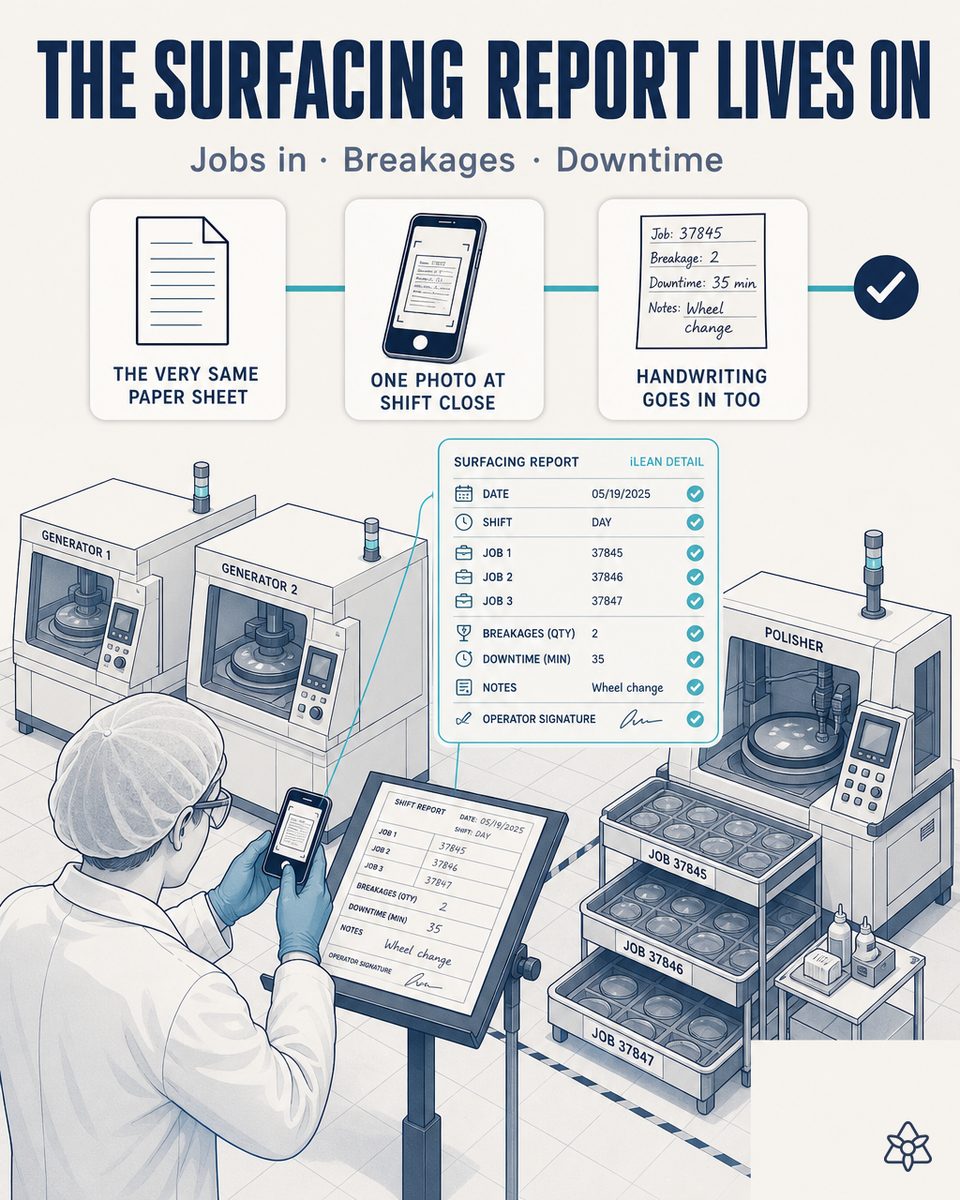
In a high-volume optical plant, every surfacing line closes the shift with a paper report: jobs in and out, lenses broken at blocking, minutes of polisher downtime and why. It is the only real picture of eight hours of work, and today it ends up in an office tray until someone types it. With Connect in photo mode, the line manager photographs it at close and the entire shift exists in the central system at second zero.
The data continuous improvement needs is born on paper and dies on paper.
In a plant that surfaces prescription lenses, the shift report is the most honest document produced: it records what really happened on the line for eight hours. And it is exactly the one that travels worst towards the system where it would be needed:
- Latency of 8 to 24 hours, and it arrives aggregated — the report is typed the next day, or when someone has a moment. And what reaches the ERP comes summed up, with no root cause: how many lenses broke, not why or on which machine.
- A month of history reconstructed by hand — the continuous improvement manager needs the detail by cause, machine, shift and material to open a variation reduction project. Today they reconstruct it digging through reports in folders. By the time they have it, the deviation has been alive for weeks and has already produced its scrap.
- The most valuable part survives worst — the observations written in the margin, which are what truly explain what happened, fit in no ERP box and get lost in transcription.
The result is a plant that measures its scrap but does not explain it: it knows how much broke and not what to act against. And in optics that weighs double, because a broken prescription lens is not recovered — it is remade.
Connect in photo-the-analog mode — the same sheet, plus a photo at close.
Digitizing the report does not demand redesigning the sheet or asking the line manager to type at the end of an eight-hour shift. It demands that what is already written reaches the system the moment it is written. That is what Connect in photo-on-paper mode is for.
The manager photographs the report at shift close with the phone or tablet they already carry. Connect recognizes the sheet's structure as it is, extracts line, shift, jobs in and out, breakages, stoppages and cause, and keeps the handwritten observations as searchable text.
How Connect photo operates on the surfacing shift report:
- The sheet is not redesigned — the model anchors to the house report's real structure. There are no columns to normalize, no boxes to add, no habit to change: the manager closes the shift as always and adds a photo.
- Extraction by cause and by machine — line, shift, jobs in and out, lenses broken at blocking, minutes of polisher downtime and the noted reason. The data enters structured along the axes later needed to attack scrap.
- The margin observations are kept — what is handwritten outside the boxes is not discarded: it is stored as searchable text tied to that line and that shift. It is what explains the "why" when the number only says the "how much".
- Doubtful data held — if a figure arrives ambiguous or a box does not match the template, the field is held and a person confirms it before it counts. The doubtful never crosses into the central system alone.
- Immediate queries instead of archaeology — from then on, asking "which breakage cause repeats on polisher 3 on the night shift this month?" stops being a project and becomes a query.
Paper report vs. report digitized with Connect
| Aspect | Classic paper report | With iLEAN Connect photo |
|---|---|---|
| Report → central system latency | 8-24 h, sometimes more | Second zero — a photo at shift close |
| Granularity of the scrap data | Aggregated, no root cause | By cause, machine, shift and material |
| History to open a project | A month reconstructed by hand | An immediate query |
| Observations written in the margin | Lost in transcription | Kept as searchable text, tied to line and shift |
| Deviation detection cycle | Weeks — the scrap already happened | Days, with the detail to act |
| Line manager's habit | The same sheet — plus someone else's transcription | The same sheet — plus a photo |
Impact estimate for your plant — to be validated with your own numbers.
The block below is an estimate to be validated against your plant's actual data. We put it forward so the committee has an order of magnitude; we refine it during the assessment.
- High-volume optical plant with several surfacing lines and several shifts, a paper shift report and scrap that today is only seen aggregated.
- Connect photo pilot on the shift report — with the phone or tablet already in the plant, without redesigning the sheet or changing the work standard. First value expected within a few weeks.
- Indicative payback between 4 and 9 months, resting on the recovered transcription time and, above all, on shortening the method deviation detection cycle. Estimate to be validated.
- The lever that weighs most is not the typing saved: it is that the detection cycle shortens. Every week a method deviation lives undetected is scrap of lenses that are never recovered.
- This case is also the enabler of the rest of the matrix: without the shift existing in the system from second zero, no downstream analysis — remake by cause, correlation with the vacuum load, the batch evidence pack — starts from real data.
And the fair question from the continuous improvement manager
"What if the model misreads a figure from the report or misinterprets a handwritten cause?" — hallucination is a problem of free generation, not of anchored tasks. Here the AI limits itself to recontextualizing what is already written against the house's real template: it is the class of task where the best models brought the error below 1.5% [1]. And even then, the doubtful is held and a person confirms before the record counts. The three safety rings are there precisely for this.
[1] OpenAI paper "Why Language Models Hallucinate", 2025 — on the reliability of AI in anchored tasks.
What people ask about digitizing the surfacing shift report
Does the shift report have to be redesigned for Connect to read it?
No, and it is a design condition. The report stays exactly as it is because it works and is tuned to how a shift actually closes in that plant: its boxes, its order, its margin observations column. The model anchors to that specific structure, not the other way round. No columns to normalize, no fields to add, nothing different for the line manager to fill in. Since the change to the standard is minimal — a photo at close — the habit holds after the pilot without auditing discipline.
What happens with what is handwritten outside the boxes?
It is kept, and it tends to be the most useful part. The margin observations — "polisher 3 has been acting up since mid-afternoon", "the new substrate batch breaks more at blocking" — are what truly explain what happened, and they are exactly what does not survive transcription today because they fit in no ERP field. Connect stores them as searchable text tied to that line, that shift and that machine. It does not try to turn them into a numeric value or interpret them: it presents them as observations, which is what they are, and keeps them available for whenever someone investigates that machine or that material.
How does this change scrap analysis?
It goes from counting to explaining. Today the ERP receives scrap aggregated: how many lenses broke. That serves for reporting, not for acting. With Connect the same data enters broken down by cause, machine, shift and material, which are the four axes you can intervene on. The question that today demands digging through reports in folders — whether blocking breakages concentrate on one specific polisher or one substrate batch — becomes a query. And since the data arrives the same day, the deviation is attacked when it is days old, not weeks.
Does it work with several lines and several shifts at once?
Yes — that is a volume optical plant's normal day. Each photo stays tied to its line and its shift, which the model extracts from the report itself against the template. It does not mix lines or drag data from the previous shift: if the line on the report does not match the one the system expects, it is held and a person resolves it. The central system keeps a timeline per line and per shift, queryable by the continuous improvement manager, by production and by whoever later prepares the batch evidence.
How long until the first useful data point?
A pilot on one line can deliver value within a few weeks: anchor the model to the house's specific sheet and start accumulating shifts. The first deliverable is not a dashboard, it is something simpler and more useful: being able to answer, for a specific week, which breakage causes appeared on each machine and each shift without digging up a single paper. From there, every week of history makes the cause-machine-material correlation more solid — which is the base Edge inspection and the batch evidence pack later rest on.
More cases from this series
- The medical device audit, always readyImpact test, coating tests, optical verification and operator competence: the batch dossier assembles…
- Reading the AR chamber’s panel without touching the machineAn external camera reads the anti-reflective chamber’s panel and digitizes each load’s curve without…
- Receiving semi-finished lenses and monomer, with a photoA photo of the delivery note and the pallet labels: batch, quantity and expiry enter the ERP with one…
- Mounting without typing: the prescription travels from the job to the machineTracer, edger and laser marking stitched to the lab management system and the ERP: zero typing of axis…
- The GEMBA walk that enters the system by talkingThe supervisor dictates through an earpiece what they see while walking; iLEAN structures it with line,…
- The test laboratory’s Excel reaches the ERP on its owniLEAN reads the test sheet when it is saved, structures it and feeds it into the ERP after human…
How many shift reports do you have undigitized today?
We work on your plant's real data, not ours. We show you the reading working on your own shift report. Assessment with no commitment.
See how we would apply it in your plant — demo with a real report ‹ See all 12 eyewear cases See apparel, footwear & accessories