APM with AI — the critical asset stops being measured at month-end and starts anticipating its own failure.
APM fails when it is built on isolated data — the dashboard draws what it could join, not what matters. iLEAN cross-references Edge (early symptom on the line), MES/SCADA/CMMS (what you already have) and the operator's voice (what only lives in their head) so APM measures the asset for real and anticipates known failure modes. The maintenance person decides and signs off.
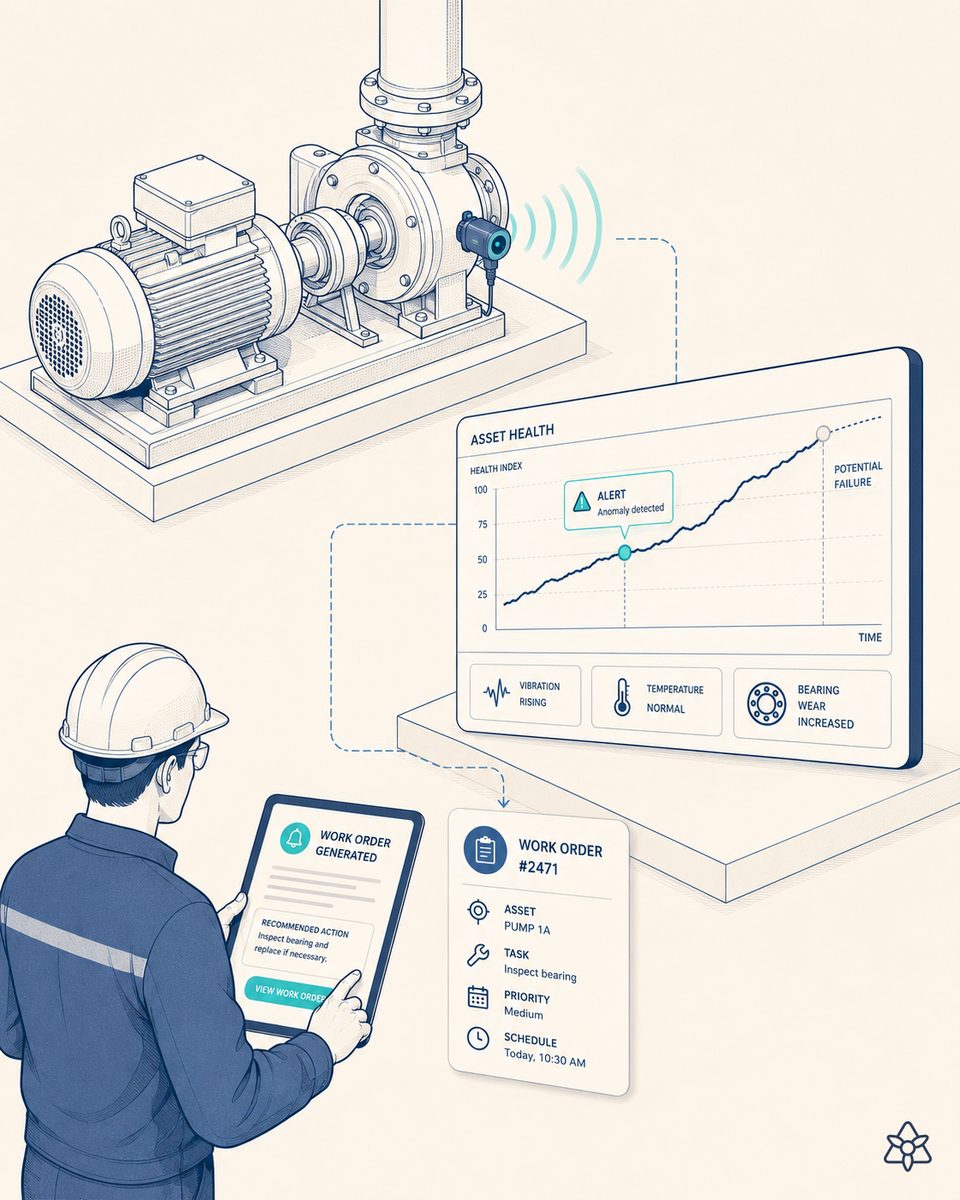
APM inherits an old problem: asset data lives on islands.
APM (Asset Performance Management) was meant to be the tool that measures and improves the performance of critical assets over time. In practice, in many plants it is a monthly slide deck with five KPIs that nobody uses to decide anything. The cause is not the tool — it is what feeds it:
- SCADA and PLCs hold the most critical data (cycles, stoppages, temperatures) but without integration they stay "locked inside a machine that tells nobody about it".
- The CMMS has the maintenance hours — but only the ones that made it into the system. Half of the asset's reality travels by messaging app and word of mouth.
- The veteran knows the real cost of keeping that asset running, the recurring failure modes nobody documented, and the difference between the SCADA's "running" and actually running. That lives in their head.
- The ERP has the cost of the spare parts consumed — but it is never cross-referenced with real availability to produce a cost per asset hour.
The result: APM draws an asset delivering 87% of plan on its headline KPI, while the person operating it knows it actually produced 30% less than it should have, burned an extra unplanned spare part, and ran "odd" for three shifts. The plant committee makes investment decisions with the first number; the second one is the real one.
iLEAN cross-references the asset's reality: what the sensors see, what the operator says and what the legacy system hides.
A well-built APM with AI is not a prettier dashboard — it is an APM built on complete capture. That means iLEAN acting as the filler between SCADA, CMMS, ERP and the operator's voice, and agents cross-referencing all of it to produce asset metrics that management can defend.
Edge sees the early symptom. Connect joins SCADA, CMMS and voice. The agent produces the real cost per asset hour and proposes the intervention. The maintenance person signs off.
The iLEAN pieces applied to APM:
- Edge — a terminal with computer vision and sensor inputs next to the critical asset. It measures the reality of the cycle on the line (not just the SCADA's version when it reports), detects the early symptom (vibration, thermal halo, leak, noise) and cross-references it with known failure modes. When it triggers, it does so in milliseconds and with no network needed.
- Connect — the filler between SCADA, CMMS, ERP and the operator's voice. It reads from the SCADA even when it is old (directly, or by reading from the PC in the cabinet), from the CMMS even when it is poorly fed, and it captures the operator's voice note and the photo of the panel that used to travel by messaging app.
- Agents (in Central) — they produce the real asset metrics: true availability, MTBF / MTTR cross-referenced with the reports captured by voice, cost per asset hour (energy + spare parts + labor hours + real output), and intervention proposals. The "boring and concrete" part of the agent closes the loop (the asset file for the committee, the dossier for the audit).
Classical APM vs. APM with iLEAN
| Aspect | Dashboard-based APM | APM with iLEAN Edge + Connect + Agents |
|---|---|---|
| Source of the KPIs | Whatever SCADA and the CMMS could export | SCADA + CMMS + Edge + voice + ERP cross-referenced |
| Reported vs. real availability | Reported matches whatever the system saw | Real, verified on the line by Edge |
| Cost per asset hour | Estimate from reported spares and hours | Real, with output measured on the line + voice |
| Failure anticipation | Reactive (the failure already happened) | Early symptom + known failure mode = alert |
| Comparison between similar assets | Hard — each one reports its own way | Metrics normalized by the agent |
| Modernization/replacement decision | Gut-feel argument or age-based replacement | Real cost + trend → investment case |
Impact estimate for your plant — to be validated with your numbers.
The block below is an estimate to be validated with your plant's data. We lay it out so the committee has an order of magnitude; we refine it during the diagnostic.
- Medium or large industrial plant, 5-15 critical assets, APM in use but with low operational impact. Existing SCADA + CMMS + ERP; a parallel spreadsheet kept by the maintenance manager; the operator's voice outside the system.
- Pilot on 3 critical assets selected by Pareto: Connect against SCADA/CMMS/ERP plus voice capture, Edge on at least one of them, and an agent producing metrics and proposing interventions. First value expected within a few weeks.
- Indicative payback between 4 and 9 months. Hard lever: a single unplanned stoppage avoided on a bottleneck asset, or one modernization/replacement decision redirected by the real measured cost.
- Expected reduction in unplanned downtime hours on the pilot assets of the order of ≥30% after the first learning cycle.
And the operations director's fair question
"What if the agent's KPIs don't match the SCADA's?" — good question. The reality is that they often don't match because the SCADA only sees part of the picture. The agent does not invent: it cross-references several sources and, when there is a divergence, it says so with its traceability — this is the SCADA reading, this is the operator's voice note, this is the Edge reading, this is the difference. Hallucination is a problem of free generation, not of anchored tasks; on anchored tasks the best models brought the error below 1.5% [1]. The system proposes; the person signs off.
[1] OpenAI paper "Why Language Models Hallucinate", 2025 — on the reliability of AI in anchored tasks.
What people ask about APM (Asset Performance Management) with AI
What is APM (Asset Performance Management) and how does it differ from a CMMS?
APM measures the performance of critical assets over time — availability, MTBF, MTTR, cost per hour, asset OEE — and connects that measurement with maintenance, replacement or investment decisions. The CMMS manages day-to-day work orders. APM is the intelligence layer over the asset; the CMMS is execution. Without a well-measured APM, the CMMS manages symptoms instead of underlying decisions.
Why do so many APM programs end up as pretty dashboards with no operational traction?
Because APM inherits the data problem: asset data lives on islands (SCADA, CMMS, IoT sensors, handwritten breakdown reports, the veteran's knowledge). If they are not joined, the dashboard is built on whatever could be joined, not on what matters — and it artfully draws an incomplete reality. iLEAN Connect seals those cracks; the Agents produce real asset metrics by cross-referencing everything. APM stops being a monthly slide deck.
How does iLEAN anticipate the failure mode of a critical asset before it becomes downtime?
With Edge watching the asset (vibration, noise, thermal halo, leak, visual sign), the Agents cross-referencing that signal with the asset history and with known failure modes (from RCM or from the veteran's captured experience), and Connect distributing the alert through whichever channel the responsible maintainer already uses. The system does not decide the intervention — it proposes, and the person signs off. The anticipation window depends on the asset and the failure mode, and is validated during the pilot.
Can the real cost per hour of a critical asset be measured with iLEAN?
Yes — and almost always the first APM exercise with iLEAN is exactly that: cross-referencing real output (Edge + MES + SCADA), energy and consumable usage, maintenance hours (CMMS + manual reports captured by voice), and the asset's commercial commitments. The result is a defensible cost per hour for the critical asset, not an estimate. From there, modernization or replacement decisions are argued with data instead of impressions.
What is the difference between APM with AI and a BI dashboard built on maintenance data?
A dashboard draws what it has. APM with AI generates the missing data (the operator's reading, the paper report, the early symptom Edge sees before it becomes a breakdown), joins it, and the Agents propose actions — they don't just present charts. Classical BI is only as good as the data reaching it; with iLEAN, the data reaching it is the reality of the plant, not whatever a fragmented system managed to capture.
Related solutions: RCM with AI · AI-augmented CMMS · Digital operator rounds
More cases in lean manufacturing
- LOTO/tagout audit with AI — the living lockout dossier, step by step.iLEAN Connect captures every lockout/tagout step by voice and photo, and the agent builds the LOTO audit…
- A3 Thinking: structured problem solving on one sheetiLEAN digitizes A3 Thinking: single sheet, structured hypothesis, live data. The Toyota tool so every…
- Digital Andon: plant signaling with auto-escalationiLEAN digitizes Andon: auto-escalation, every alarm logged, no isolated light columns. When something…
- Autonomous maintenance TPM — if it demands paper, it doesn't work. You know it and so do we.iLEAN turns autonomous maintenance into a digital flow: the operator reports by voice or photo and the…
- Cellular manufacturing with AI — cells designed with your plant's real data, not with the consultant's spreadsheet.How iLEAN designs, balances and keeps manufacturing cells alive with real plant data: part families,…
- Your CMMS isn’t lying — it’s incomplete. iLEAN completes it with voice, photo and an agent.How iLEAN turns your CMMS into a living tool: voice and photo capture on the floor, work orders…
Tell us your case and within 48h we'll send you the estimated ROI of an APM measured on the asset's real behavior.
We work on your plant's real data, not on ours. Diagnostic with no commitment.
Request estimated ROI in 48h See Lean Manufacturing