The drum roaster is still the same machine, but now it talks
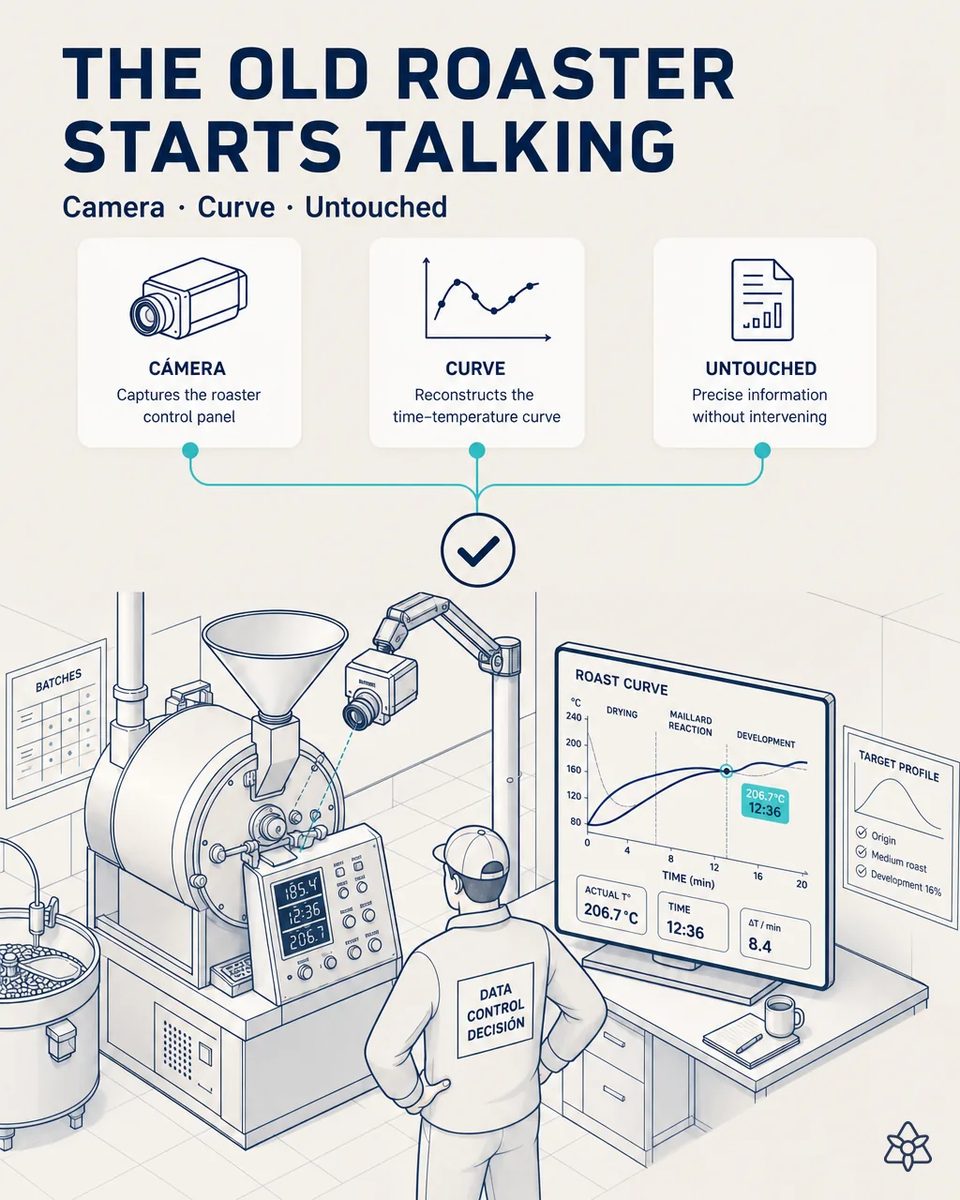
A coffee plant's drum roaster is typically ten to twenty-five years old, the bottleneck of the plant and its most expensive asset. Its panel shows everything that defines the product — inlet temperature, bean temperature, the full curve, first crack, airflow — and all of it disappears when the batch ends. Replacing it is major CAPEX with weeks of downtime. With iLEAN Connect an external camera pointed at the panel is enough: the curve is digitised batch by batch, without touching the original control system.
The recipe lives in two equally fragile places.
The roast profile is both the recipe and the competitive advantage of a coffee plant. Today it lives in two equally fragile places: the machine's screen, wiped when the batch ends, and the head roaster's memory. When that person retires or moves plants, the knowledge goes with them and no record remains of how the profile was achieved. The obvious route — replacing the roaster with a modern one that exposes data — is rarely on the table: it's significant capital expenditure plus weeks of downtime on the main line, and many manufacturers deliberately keep the panel off the network. The project sits on the list for years and never reaches the top. That's a normal industrial situation, and it doesn't have to be solved to get the data. Meanwhile nobody can correlate the curve with shrinkage, with the sensory profile or with customer complaints. Root-cause analysis of a specific batch is simply impossible. And in a multi-plant group there's no way to verify whether two factories are roasting the same coffee the same way.
- The machine screen, wiped as soon as the batch ends.
- The head roaster's memory: when they retire or move plant, the profile goes with them.
- Replacing the roaster is not on the table: it is major CAPEX plus weeks of downtime on the main line, and many manufacturers deliberately keep the panel off the network.
- Meanwhile nobody correlates the curve with weight loss, sensory profile or the customer claim. Root-cause analysis of one batch is simply impossible.
Connect in photo-the-analog mode over a machine panel.
Connect in "photo of the analogue" mode over a machine panel. The flow:
What does not happen matters as much as what does: no cable, no firmware change, no modification that could compromise the warranty or the qualification of the equipment.
- A fixed industrial camera points at the panel screen and captures every few seconds, in a mounting that requires no intervention on the equipment.
- OCR with a grounded language model reads each frame and reconstructs the full time curve of the batch: temperatures, timings, milestones.
- The curve is cross-referenced with the management system to attach it to the lot and order that were in the machine at that moment.
- The result becomes available for correlation with shrinkage, sensory profile and complaints, and for comparing the same origin across plants.
What doesn't happen matters as much as what does: not one cable, not one firmware change, nothing that could compromise the warranty or the equipment qualification. The machine remains exactly the same machine.
A curve that disappears vs. a curve on record
| Aspect | Today | With iLEAN Connect |
|---|---|---|
| The batch curve | Wiped when it ends | Recorded batch by batch |
| Roast profile | In one person's head | Documented and repeatable |
| Root cause of a batch | Impossible | In minutes |
| Work on the machine | — | None: no cable, no firmware |
| Same origin at two plants | No way to verify | Comparable |
| Replacement CAPEX | On the list for years | Deferrable |
zero correlation between curve and outcome → root-cause analysis per batch in minutes. A profile living in one person's head → a documented profile, reproducible at another plant. Replacement CAPEX on the critical asset → indefinitely deferrable.
Impact estimate — to validate against your numbers.
The block below is an estimate to be validated against your plant's actual data. We put it forward so the committee has an order of magnitude; we refine it during the assessment.
- Drum roasters ten to twenty-five years old, the bottleneck and most expensive asset in the plant.
- Indicative payback between 5 and 10 months.
- Plus avoiding the replacement CAPEX of the critical asset, which is the large item.
- And lower roasting weight loss through correlating curve with defect.
estimated payback of 5 to 10 months, plus avoided replacement CAPEX on the critical asset and reduced roasting shrinkage through curve-to-defect correlation. *Estimate to validate*.
And the fair question from the production manager
“Is a camera reading a screen reliable?” — it is the right question, and the answer depends more on the mounting than on the model: fixed camera, stable framing, controlled lighting. Under those conditions reading digits off a panel is about as anchored as tasks get. It is checked in the first week against manual readings, and if a particular panel will not read, that gets said before anything is committed.
[1] OpenAI paper "Why Language Models Hallucinate", 2025 — on the reliability of AI in anchored tasks.
What people ask about reading the roaster panel
Does it affect the machine's warranty or qualification?
No, because nothing is touched. The camera is an external element pointed at the screen, exactly as a person looking at it would be. That is what makes the case viable: integrating with the control would mean opening a qualified asset, and there the project stops forever.
Why not just put the panel on the network?
Because on many roasters of this age the manufacturer deliberately keeps it isolated, and where it can be done, the work touches the control of the plant's most expensive asset. It has been on the project list for years and never reaches the top. The camera avoids that discussion entirely.
How often does it capture?
Every few seconds, which is what it takes to rebuild the curve at the resolution roasting decisions are actually made at. It is not continuous video: they are discrete readings later assembled into the batch's time curve.
How does it know which batch the curve belongs to?
It is cross-referenced with the management system to tie it to the batch and order that were on the machine at that moment. Without that link the curve is a nice chart and little else; with it, it is what explains why that batch came out the way it did.
Does it help compare two plants roasting the same origin?
That is one of the reasons to do it in a multi-plant group. Today there is no way to verify whether two factories are roasting the same coffee the same way, and that question always comes up after an acquisition. With both curves on record, the comparison is direct.
More cases from this series
- From two weeks reconstructing traceability to zeroEvery critical change generates its dossier: before/after photos, decisions and signatures, reorganised…
- Ten acquired factories, one operational languageA capture and normalisation layer over the systems that already exist makes M&A-acquired factories speak…
- Lot, date and allergens stop depending on someone typingLot, date and allergens travel from the active order to the coder via API. Zero typing on the machine…
- Goods-in stops blocking the dock manager for an hourPhotograph the docket and the sack labels: iLEAN extracts lots and origin certificates, the manager…
- What the shift lead knows stops evaporating every eight hoursThe shift lead dictates issues while walking between retort and filler; the AI structures them, links…
- The shift quality sheet stops being retyped by handiLEAN reads the quality sheet as it is saved, normalises it to the group model and, after sign-off,…
Tell us which roaster you have and we will say within 48h whether its panel reads.
We work on your plant's real data, not ours. Assessment with no commitment.
Request estimated ROI within 48h ‹ See all cases of coffee, culinary, snacks and foodservice See food