Ten acquired factories, one operational language
The capital pain of a food group built through acquisitions isn't a line defect: it's that its factories can't be compared with each other. Ten plants from different owners, in different countries, running four different processes, each with its own ERP and its own definition of waste and yield. The known route — replacing each plant's ERP — is a multi-year project. The iLEAN flagship system puts a capture and normalisation layer over what already exists: the plants start speaking one language without any of them changing its ERP.
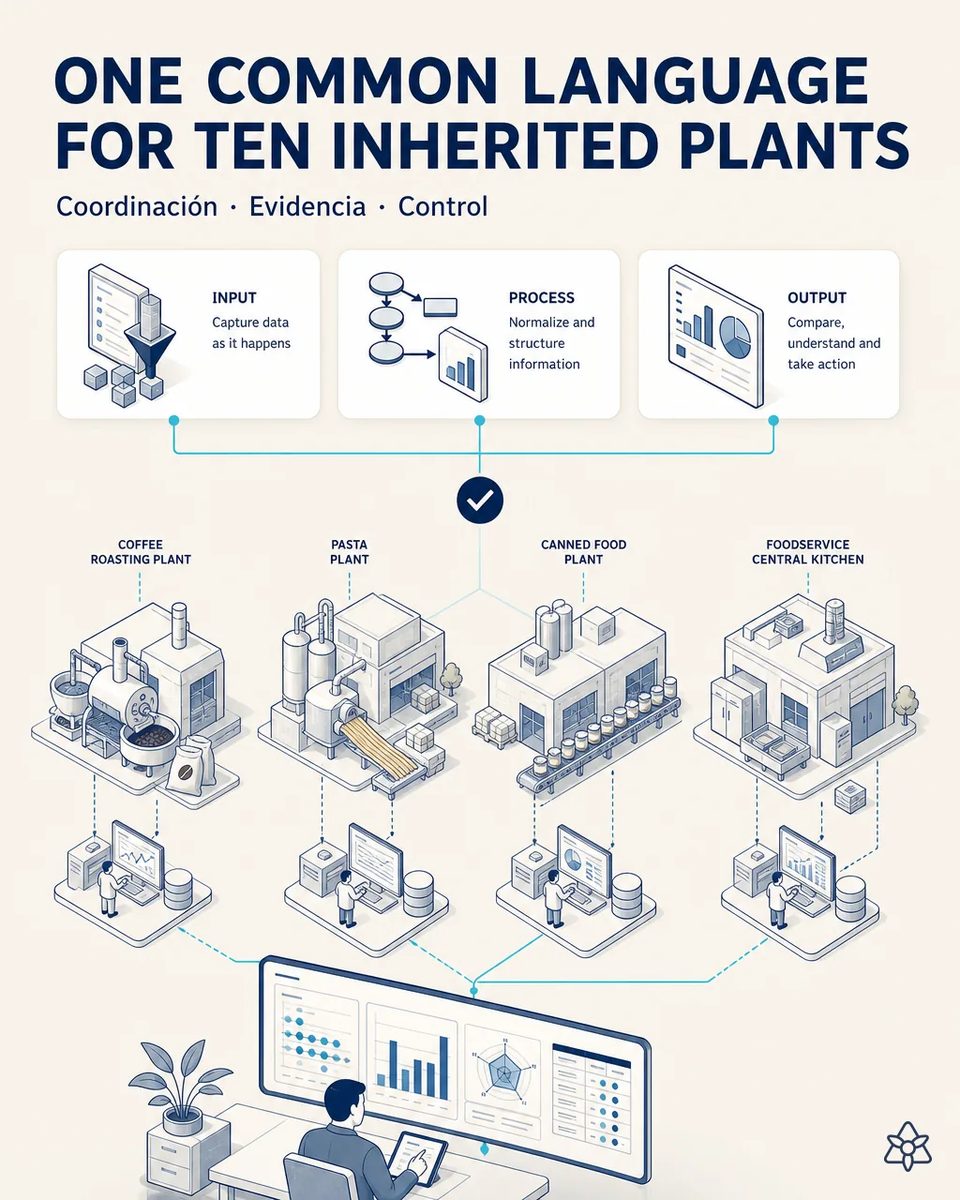
Without comparability there is no synergy, and every month the acquired plant stays illegible is synergy lost.
The industrial synergy promised in every acquisition depends on being able to compare. Without comparability there's no benchmark between plants, no transfer of best practice from one factory to another, and no way to connect operational performance with financial performance — which is exactly what a corporate manufacturing directorate is asked to do. When that directorate asks which is its worst-performing plant, the answer takes weeks and arrives debatable — and a debatable figure is no use for an investment decision or for defending a synergy in committee. The reason isn't a lack of data: it's that each plant measures on its own definitions, on its own system and with its own logs. The known route to fix it is replacing the ERP at each acquired plant. That's a multi-year project nobody wants to sign on day one of an integration, and meanwhile the synergy goes uncaptured. Every month the acquired plant takes to become legible is synergy lost.
- Without comparability there is no benchmark across plants, no transfer of good practice from one factory to another, and no way to connect operational with financial performance.
- When management asks which is the worst plant, the answer takes weeks and arrives arguable. And an arguable figure is no use for an investment decision or for defending a synergy in committee.
- It is not a lack of data: each plant measures with its own definitions, on its own system and with its own logs.
- The known route — replacing each acquired plant's ERP — is a multi-year project nobody wants to sign on day one of an integration.
Four coordinated layers on top of the systems that already exist.
four coordinated layers over the existing systems.
Each plant's ERP stays its own. That is what turns the project into months instead of years, and what decouples migration from the synergy calendar.
- Capture without touching the systems (cases 1-4 and 7): the roast log, the roaster panel, the goods-in docket, the shift lead's voice and the channel alerts come in by photo, OCR and voice. The acquired plant installs nothing new and changes nothing about how it works, becoming legible from month one.
- Human gate and normalisation (cases 5 and 6): every data point passes through two-tap validation and is translated into the group's common model — the same definition of lot, waste and yield across all four process technologies, even though each plant keeps its own names.
- Stitched to what's already there (case 8): Connect links the modern systems already present at each site — ERP, coder, scales — through their APIs instead of replacing them. Each plant's ERP stays its own. This is what turns the project into months rather than years.
- Control and evidence (cases 9, 10 and 11): Edge brings the same visual criteria to every plant, JIDOKA AI blocks start-up when a critical change isn't validated, SMED AI shortens that change, and Agents leaves the audit evidence pack per plant and per standard.
The result is a comparable dashboard across every factory and the owned channel, on shared definitions, fed by what already happens on the floor.
Reacting to the integration vs. the four layers
| Aspect | Today | With the full system |
|---|---|---|
| Comparing two plants | Not possible | Same definitions |
| “Which is my worst plant?” | Weeks, and arguable | One common operating picture |
| A newly acquired plant | Legible once its ERP migrates | Legible in the first month |
| Each plant's ERP | A replacement candidate | Theirs, untouched |
| Project duration | Years | Months |
| Industrial and financial | Two conversations | One |
weeks of manual work and debatable figures → one operational picture for every plant. "The acquired plant will be legible when we migrate its ERP" → legible in month one of the integration, with migration decoupled from the synergy timetable. Industrial and financial performance in two conversations → in one.
Impact estimate — to validate against your numbers.
The block below is an estimate to be validated against your plant's actual data. We put it forward so the committee has an order of magnitude; we refine it during the assessment.
- Food groups built through acquisitions, with four process technologies coexisting.
- The main value is not a savings line: it is bringing forward the synergy capture of each integration.
- On top of that come the individual paybacks of the eleven earlier cases, collected along the way.
- Indicative payback for the whole between 6 and 12 months, dominated by ERP license savings and avoided risk. To be validated with manufacturing and finance, against the real integration calendar.
the main value isn't a savings line but pulling forward the synergy capture of every integration and being able to move best practice between plants that are finally comparable. On top sit the individual paybacks of the eleven earlier cases, collected along the way. Payback for the whole estimated at 6 to 12 months, dominated by ERP licence savings and avoided risk. *Estimate to validate* with manufacturing and finance, against the real integration calendar.
And the fair question from the production manager
“Do all four layers have to be deployed for this to be worth anything?” — no, and it would be a bad idea. Each layer works and pays for itself on its own; what the four together give is comparability. The usual order starts with capture and the human gate, which are the cheapest and feed everything else, and continues wherever each plant's pain is most expensive.
[1] OpenAI paper "Why Language Models Hallucinate", 2025 — on the reliability of AI in anchored tasks.
What people ask about making ten factories speak
Where do you start?
With capture that does not touch the systems, and the human gate. They are the cheapest pieces, they make an acquired plant legible from the first month, and they are the condition for the rest to have anything to work with. Vision and the dossier come afterwards, at whichever plant has the most expensive pain.
Really no ERP migration?
Not for the comparability, which is what is being bought here. Migration can still go ahead if it makes sense for other reasons, but it stops being the bottleneck of the synergy. That decoupling is half the value of the case.
What does “normalize” mean if every plant calls things differently?
That the definition of batch, weight loss and yield gets translated into a common group model on iLEAN's side, while each plant keeps calling things what it always called them and filling in its own logs. Imposing vocabulary on a newly acquired factory is the fastest way to stall an integration.
Does it work across four such different process technologies?
That is precisely the case: roasting, extrusion and drying, canning and retort, and central kitchen have different vocabularies and different failure modes. What is shared is not the process, it is the definition of the magnitudes things are judged by — weight loss, yield, cost per kilo — and those do admit a common model.
How long does the full deployment take?
Layer by layer, over months rather than weeks, and that is deliberate. Each layer goes live, gets validated at one plant and gets replicated. A group that tries to deploy four at once across ten sites ends up with forty half-finished projects, which is the usual failure mode.
More cases from this series
- From two weeks reconstructing traceability to zeroEvery critical change generates its dossier: before/after photos, decisions and signatures, reorganised…
- Lot, date and allergens stop depending on someone typingLot, date and allergens travel from the active order to the coder via API. Zero typing on the machine…
- Goods-in stops blocking the dock manager for an hourPhotograph the docket and the sack labels: iLEAN extracts lots and origin certificates, the manager…
- What the shift lead knows stops evaporating every eight hoursThe shift lead dictates issues while walking between retort and filler; the AI structures them, links…
- The shift quality sheet stops being retyped by handiLEAN reads the quality sheet as it is saved, normalises it to the group model and, after sign-off,…
- The alert that dies in an inbox now reaches production in secondsAlerts from your own restaurant channel reach production in seconds, cross-checked against live orders…
Tell us how many plants you have and how many different definitions of weight loss.
We work on your plant's real data, not ours. Assessment with no commitment.
Request estimated ROI within 48h ‹ See all cases of coffee, culinary, snacks and foodservice See food