The closed induction furnace that finally talks
The induction furnace is a foundry's most expensive asset and is usually ten to twenty-five years into service. Its panel shows power, bath temperature, holding time and alarms, but it sits isolated because the builder shipped it closed. With iLEAN Connect, an external camera pointed at the panel turns that screen into a time series per heat, without touching the machine or its warranty.
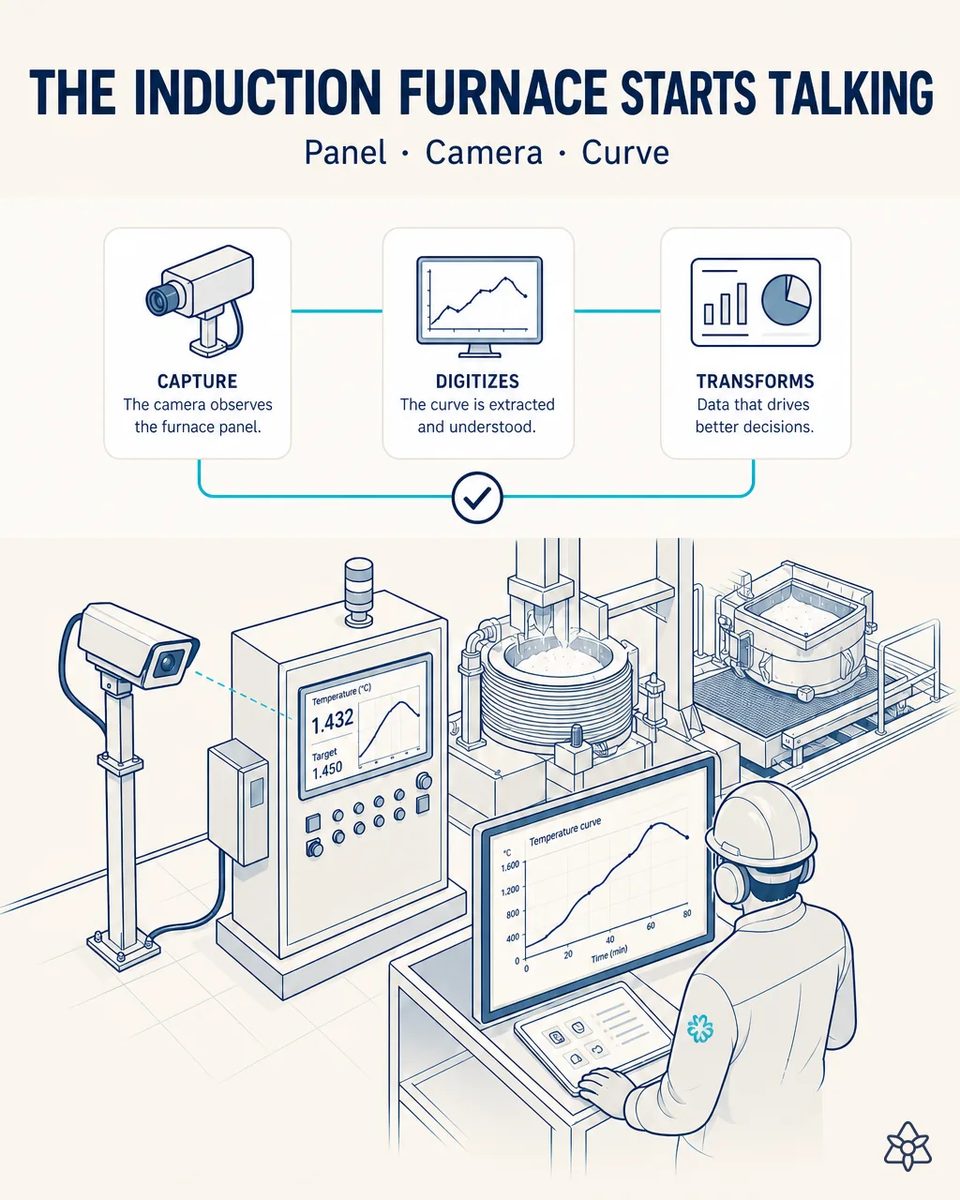
The most expensive asset in the plant leaves no record of what it does.
Replacing or retrofitting the panel means seven-figure CAPEX and weeks without melting, which in a foundry is the same as stopping the entire plant. So the data stays inside: every time the screen refreshes, the information is gone. The result is that nobody correlates furnace behavior with metallurgical outcome or with consumption. In an electricity-intensive process, where energy per metric ton is one of the big lines in the P&L, that correlation is direct money. The relationship between superheat, holding time, refractory wear and defect is written down nowhere: it lives in the experience of two or three people.
- The induction furnace is ten to twenty-five years into service and its builder shipped it closed: power, bath temperature, holding time and alarms live on a screen that refreshes and forgets.
- Retrofitting the panel means seven-figure CAPEX and weeks without melting, which in a foundry is the same as stopping the whole plant. So the retrofit stays in the plan, year after year.
- So nobody correlates superheat and holding time with nodularity, with defects or with energy per metric ton, in a process where electricity is one of the big lines of the P&L.
- The relationship between refractory wear, tapping temperature and a shrinkage run is written nowhere: it lives in the experience of two or three melters, and it leaves the plant when they do.
Connect in panel-photo mode — solved from outside the furnace, not inside.
Connect in panel-photo mode — the same mode as the previous case, applied to a machine instead of a document:
It touches nothing: no ports opened, no PLC modified, no warranty at risk. The camera reads the screen the way the melter does, only every few seconds and for every heat, and the result is the first complete furnace curve the plant has ever had. The same bracket-and-camera pattern then goes on the heat treatment furnace recorder, the sand plant or the spectrometer. And because the series is crossed with the heat sheet and the lab result, the plant can finally ask the question it has been guessing at for years: which superheat and which holding time give the nodularity the customer pays for, at the lowest kilowatt-hours per metric ton.
- A fixed industrial camera points at the panel, capturing periodically.
- A grounded model reads each frame and turns it into a structured time series.
- The series is cross-referenced with the heat sheet (which heat was in that furnace at that moment) and with the lab result.
- The plant gets the full curve per heat for the first time, without having touched the furnace electronics.
The same pattern works for any other silent asset in the plant: the heat treatment furnace recorder, the sand plant or the spectrometer.
Today's furnace versus the furnace being read
| Aspect | Today | With iLEAN Connect |
|---|---|---|
| Furnace curve per heat | None: the screen forgets | Complete time series |
| Superheat and holding time | In the melter's memory | Crossed with the heat sheet and the lab |
| Root cause of a defect run | Reconstructed from memory | The curve in front of you, in minutes |
| Energy per metric ton | A monthly invoice | A figure per heat and per furnace |
| Furnace electronics | — | Untouched, warranty intact |
| Panel retrofit CAPEX | Unavoidable | Deferrable, without losing the data |
from no furnace history at all to a complete time series per heat · from root-cause analysis from memory to analysis with the curve in front of you, in minutes · from unavoidable retrofit CAPEX to deferrable CAPEX without losing the data.
Impact estimate — to be validated with your numbers.
The block below is an estimate to be validated against your plant's actual data. We put it forward so the committee has an order of magnitude; we refine it during the assessment.
- Estimated payback 5-10 months.
- Panel retrofit CAPEX avoided or deferred, in the hundreds of thousands, with no weeks without melting.
- A 3-8% reduction in energy per metric ton once superheat and holding times can be tuned against the actual outcome.
- And root-cause analysis of a defect run goes from memory to the curve, in minutes.
estimated payback 5 to 10 months. Two levers: avoiding the panel retrofit CAPEX (in the hundreds of thousands) and a 3-8% reduction in energy per metric ton once the correlation allows superheat and holding times to be tuned. *Estimate to validate*.
And the fair question from the production manager
“Does a camera reading a screen give data you can trust for a metallurgical decision?” — the task is anchored: fixed screen, fields in known positions and physical ranges the value cannot leave, where the best models drop below 1.5% error [1]. Any frame whose reading falls outside the possible range — a bath temperature that jumps 300 degrees between two captures — is discarded instead of stored, so the series is clean before anyone looks at it. And the curve is never used alone: it is read next to the heat sheet and the lab result.
[1] OpenAI paper "Why Language Models Hallucinate", 2025 — on the reliability of AI in anchored tasks.
What people ask about reading the furnace panel
Does the furnace have to be stopped to install it?
No. The camera is mounted on a bracket in front of the panel and connects to nothing on the furnace. Installation happens during a normal holding period, and if the bracket is moved the reading stops rather than degrades.
Which fields can be read from the panel?
Whatever the screen shows: power, bath temperature, target, holding time and alarms. Send a photo of the panel and within a week you know exactly which fields are readable and at what refresh rate.
How is the curve tied to a specific heat?
By crossing the timestamp with the heat sheet: which heat was in that furnace at that minute. That is why this case and the heat sheet case usually go together, and why the second one costs almost nothing once the first is running.
Does it help with energy per metric ton?
That is one of the two levers. With the curve per heat you can see how much superheat and holding time each heat actually consumed and tune both against the lab result, instead of against the monthly electricity invoice.
Does the same work for the heat treatment furnace or the spectrometer?
Yes, the pattern is identical for any silent asset with a screen. You start with the induction furnace because it is where the energy and the metallurgy are decided, and then extend to whatever else refreshes and forgets.
More cases from this series
- The audit evidence pack, generated as the process happensEvery heat and every changeover leaves evidence organized by standard: IATF 16949, VDA 6.3, CQI-9,…
- Zero stoppages on the customer's line: the three coordinated ringsThree rings — signal, matter and memory — coordinate Connect, Edge and Agents to eliminate customer line…
- The alert that arrives by email, turned into a scheduling decisionPull-ins, delays and incidents arrive by email and messaging. iLEAN cross-checks them against the EDI…
- First-piece release with early human verificationNo AI-captured data enters the ERP unsigned. The line tablet shows what was captured beside its photo…
- Planning while walking the bay, hands freeThe planner walks. With an industrial earpiece, iLEAN listens, structures and answers in seconds: the…
- The heat sheet, digitized at second zeroThe heat sheet stops waiting hours on a desk: one photo and the heat exists in the central system, with…
Send us a photo of your furnace panel and we will tell you which fields can be read.
We work on your plant's real data, not ours. Assessment with no commitment.
Request estimated ROI within 48h ‹ See all cases of iron castings See automotive