Petrochemical plant OEE with AI — an OEE that has been dressed up is an OEE you cannot attack.
Petrochemical OEE combines real availability, yield and quality — and the loss is spread across feedstock, operation, assets, raw material and campaign changes. iLEAN joins the three dimensions from the DCS, the LIMS and the operator's shift reports, and breaks the loss down by root cause so the committee attacks what weighs, not what shows. The person decides and signs — always.
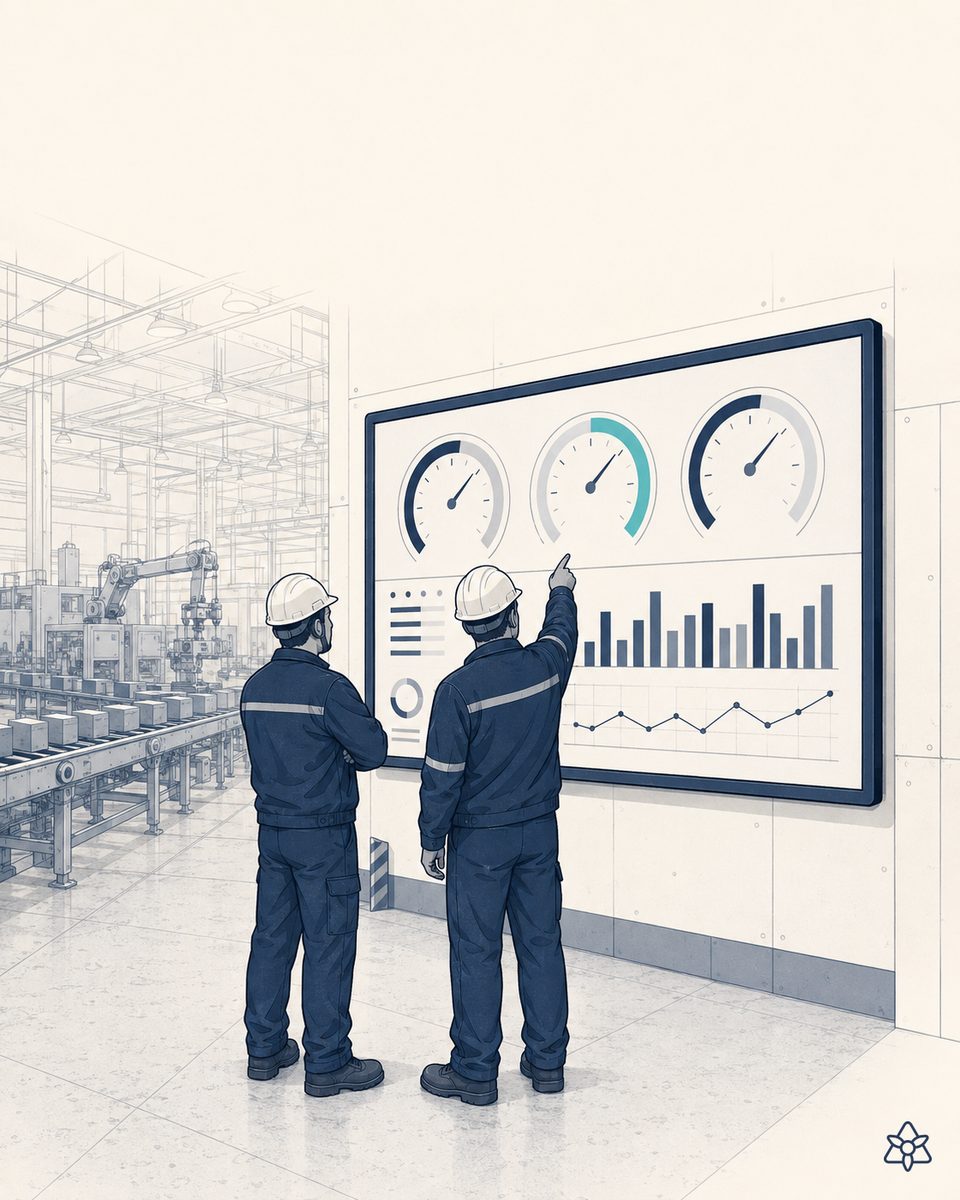
Petrochemical OEE gets published every month — and almost nobody believes it.
Any operations or process manager in a petrochemical plant knows the ritual: at month-end somebody compiles the OEE, somebody presents it to the committee, somebody explains why it went up or down. And at the back of the room everyone knows the same thing:
- Availability comes out of the DCS, but the gaps were filled in by hand by the operator on the shift report, and that entered the system a day later.
- Yield is calculated on a theoretical material balance, but the real LIMS measurements arrive with a lag and the corrections for sulfur, water and ash live on another sheet.
- Quality declares the batch on-spec, but the reblends and reprocesses that happened along the way never make it into the metric.
- Planned shutdowns are deducted or not depending on the committee — and that alone miscalibrates the indicator before the conversation even starts.
- The loss ends up in an “unclassified” bucket that grows towards year-end and nobody knows how to attack.
The result: the OEE gets published, but it does not steer anything. And meanwhile, where money really is won or lost — the yield of the hydrotreater, the severity of the cracker, the delta T of the furnaces — decisions are made on the shift manager's intuition and the veteran's memory. A petrochemical plant that operates on intuition is a petrochemical plant that performs below its real capacity.
iLEAN does not invent yet another OEE — it joins the three ingredients using the systems you already have.
Petrochemical OEE does not fail for lack of a formula: it fails because the three ingredients (availability, yield, quality) each live on an island, and joining them by hand once a month only leaves room for a defensible version, not for the operable truth. iLEAN acts as putty between the DCS, the LIMS, SAP IS-Oil and the operator's shift reports, and keeps the OEE live with the loss broken down — so the committee conversation stops being about the indicator and starts being about the cause.
Edge captures from the DCS, modern or old. Brain calculates gross and net OEE and breaks yield loss down by cause. An agent prepares the monthly dossier with the attackable cause. The person decides the action and signs — always.
The three iLEAN pieces applied to petrochemical OEE:
- iLEAN Brain — the calculation engine: gross and net OEE, yield loss broken down by feedstock / operation / assets / raw material / campaign changes, comparison against the pattern learned for each unit. It learns how your cracker, your hydrotreater and your aromatics unit behave, and separates explainable loss from attackable loss.
- iLEAN Edge — terminals that capture DCS data through whichever route is available (OPC UA, OPC DA, CSV export, OCR over a local screen), plus the readings that are still taken by hand today (tank gauges, quick tests in the field lab, operator inspections). It works with no network; in a live unit that matters.
- iLEAN Agent — one assistant per key role: the unit manager gets an alert when a severity drifts outside the learned optimum; the process manager gets the monthly dossier with the attackable root cause; the plant director gets net and gross OEE with the full genealogy — ready for the committee, not something to rebuild in a spreadsheet at 10pm on the last day of the month.
Classic petrochemical OEE vs. OEE broken down by root cause with iLEAN
| Aspect | Classic OEE (spreadsheet + DCS + meeting minutes) | With iLEAN Brain + Edge + Agent |
|---|---|---|
| Calculation frequency | Monthly, rebuilt at close | Continuous, live on the dashboard |
| Availability | Operator shift report + gaps filled by hand | DCS read continuously + contextualized events |
| Yield | Global monthly balance, with no useful breakdown | Broken down by feedstock, operation, assets and raw material |
| Quality | “On-spec batch”, with no reprocesses | Real quality cross-referenced with reblends and reprocesses |
| Planned shutdowns | Recurring argument about including them or not | Gross + net OEE, both live and traced |
| “Unclassified” loss | Grows every month | Shrinks as the system learns; only the genuinely inexplicable remains |
Impact estimate for your plant — to be validated with your numbers.
The block below is an estimate to be validated with your unit's data and your real loss. We put it forward so the committee has an order of magnitude; we refine it during the diagnostic.
- A petrochemical unit (cracker, FCC, hydrotreater, aromatics plant…) with a legacy DCS, a stable LIMS and operator shift reports on paper or tablet.
- Pilot on one unit: DCS capture (OPC or equivalent), cross-referencing with LIMS and SAP IS-Oil, live gross and net OEE, yield loss broken down by cause. First value expected within a few weeks.
- Expected reduction of the “unclassified” bucket of ≥ 30% in the first months, as the system learns the unit's pattern.
- Indicative payback between 4 and 9 months, dominated by basis points of yield recovered: a handful of bps in a large unit pays for the system comfortably. The hard lever is not saving on maintenance — it is recovering on-spec product that today degrades because of over-cracking or sub-optimal blends.
And the process manager's reasonable doubt
“What if the AI attributes the loss to the wrong cause and we attack the wrong thing?” — hallucination is a problem of free generation, not of anchored tasks. In tasks where the AI merely recontextualizes a piece of data from one system into another (reading the DCS, cross-referencing with the LIMS, breaking the balance down), the best models brought error below 1.5% [1]. And even so, root cause is never decreed on its own: iLEAN proposes the breakdown with the evidence attached, and the process manager validates and signs. The three safety rings exist precisely for this.
[1] OpenAI paper “Why Language Models Hallucinate”, 2025 — on the reliability of AI in anchored tasks.
What people ask about petrochemical OEE with AI
How is OEE measured in petrochemicals?
Classic OEE (availability × performance × quality) was designed for a discrete line. In petrochemicals the three dimensions are different: availability = hours the unit was running over calendar hours minus planned shutdowns; yield (which replaces performance) = on-spec product obtained / raw material processed, on a dry or mass basis depending on the stream; quality = on-spec batch / batch produced. iLEAN calculates the real OEE by combining DCS, LIMS, operator records and SAP IS-Oil, and separates the loss by its real cause — it does not assume it.
What about planned downtime?
Planned shutdowns (turnarounds, scheduled maintenance, commercial shutdowns due to demand) are the perpetual fight of petrochemical OEE: include them and the OEE looks bad; exclude them and it looks good but misleading. iLEAN works with whatever logic each plant agrees on: it shows gross OEE over calendar hours (including planned shutdowns) and net OEE over operable hours (excluding them), and breaks each concept down with its traceability. Management decides which metric it defends before the committee — but both are live, not invented at month-end close.
Does it work with a legacy DCS?
Yes. iLEAN Connect captures DCS data through whichever route is available — OPC UA / Modbus if the platform is modern, OPC DA or a CSV export if the historian is old, OCR reading of local screens if the unit dates from the 1990s and was never fully integrated. The DCS is not touched. The philosophy is Connect's: graduated capture — manual, intermediate or integrated — so every unit enters the system at its own level, with no obligation to renew the DCS before you can start.
How is yield loss broken down?
Yield loss is the most expensive and the worst understood magnitude in petrochemical OEE. iLEAN Brain breaks yield loss down by cause: feedstock (crude heavier than expected), operation (severity outside the optimum, low H2/HC ratio in hydrotreating, deltaP in a column), assets (fouled exchanger, deactivated catalyst), raw material quality (impurities the lab detected late), campaign changes, and unclassified phenomena (the category that shrinks the most once the system has been learning for months). The operations manager stops seeing “less yield this month” and starts seeing “we lost X in hydrotreating because of a deactivated catalyst” — actionable.
What OEE improvement is typical?
In petrochemicals, OEE improvement is not measured in scattered points — it is measured in millions of euros per year that you recover once you break the loss down and start attacking the real cause instead of the usual suspect. A handful of basis points of yield in a large plant pay for the system in very few months. The hard lever is not saving on maintenance: it is recovering on-spec product that today is lost to over-cracking or to degraded blends. We send you an estimate in 48h with your plant's data, not with a generic case.
More cases in petrochemical
- NPK fertilizer control with AI — an off-grade bag is not an incident, it is a fine and a lost customer.How iLEAN cross-checks N-P-K dosing, particle size and moisture in line with the customer spec to avoid…
- PET, PE and PVC extrusion with AI — the drift that reaches the customer when there are already 8 hours of bad reel.How iLEAN cross-references screw response, masterbatch batch, moisture drift and gel/band vision to hold…
- Circular economy in petrochemicals with AI — the mass balance does not hold up in a spreadsheet; with iLEAN, it does.How iLEAN joins invoices, lab data and operations to keep the ISCC PLUS mass balance alive, trace…
- Polymer quality on the extrusion line with AI — an out-of-spec MFI at the end of the roll is a lost roll.iLEAN combines online MFI and AI vision of the extruded product to correct the extruder before the…
- Prestressed concrete with AI — the beam that leaves with a strand at 1,510 when it should have been 1,560 is invisible until it reaches the site.How iLEAN cross-references strand tension, concrete mix design and curing so the prestressed beam leaves…
- Pulp and paper with AI — a web break gives no warning, but its signature does.How iLEAN cross-references consistency, sheet formation and in-line defects to anticipate a web break on…
Tell us about your petrochemical plant and in 48h we'll send you the estimated ROI of an iLEAN deployment for your real OEE.
We work on your unit's real data and your real loss, not on ours. Diagnostic with no commitment.
Request estimated ROI in 48h See oil and petrochemical