The vintage oven that now talks back
The curing oven or formation rectifier in a battery plant is typically over a decade old, network-isolated, and its screen shows vital data every few seconds. Replacing it costs hundreds of thousands of dollars and weeks of downtime. With iLEAN Connect, one external camera pointed at the panel is enough: the machine stays itself, but now the plant has its curve digitized in central memory, lot by lot.
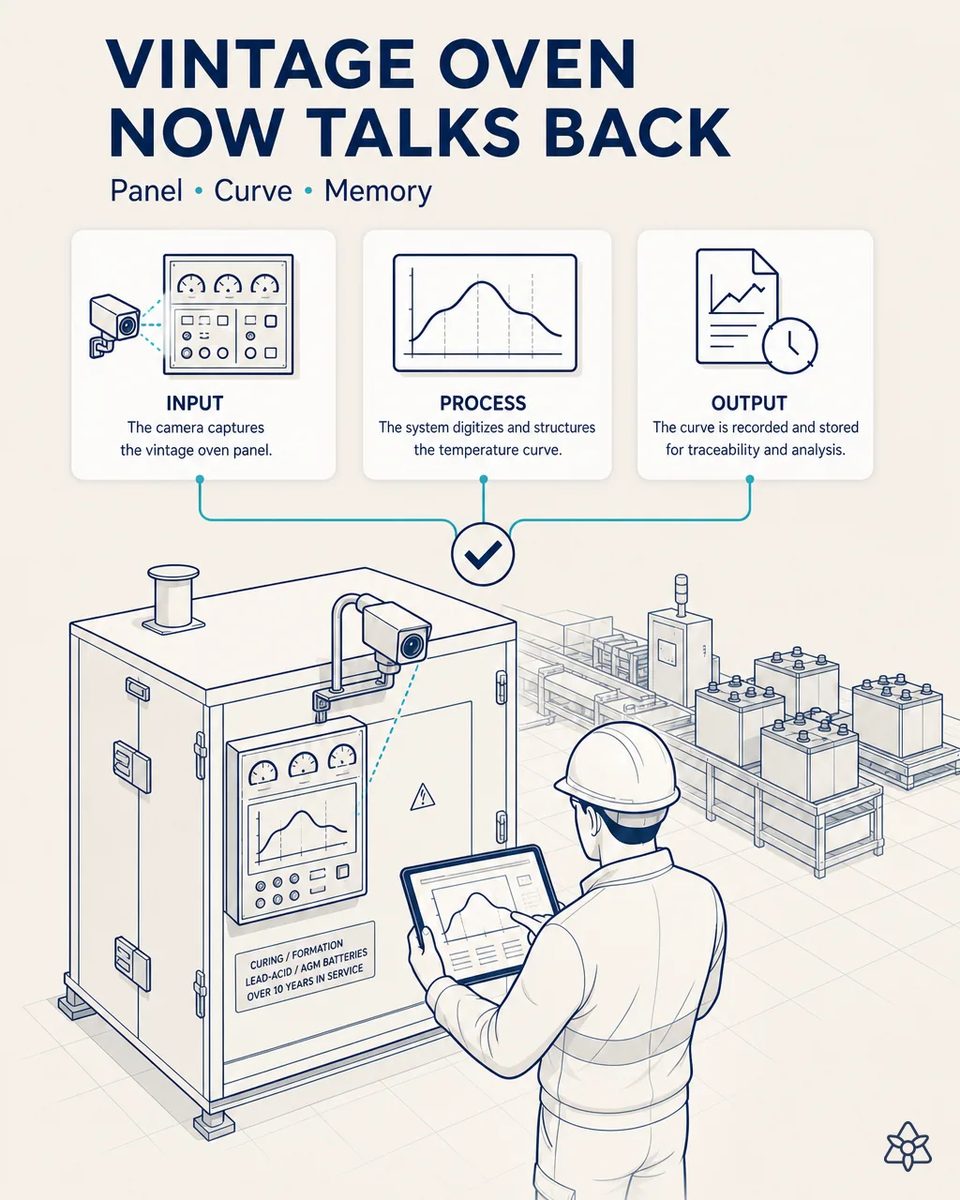
The curve that gives the battery its energy disappears every time the screen refreshes.
The formation/charge curve is literally what gives the battery its energy — a curve out of range directly predicts low capacity or CCA, but today nobody correlates curve to final test result because the panel's data dies every time the screen rotates.
- The curing chamber or the formation rectifier is typically over a decade old, isolated from the network, and shows humidity, temperature or charge current every few seconds on a local screen. Many were installed when nobody expected them to share data with anything.
- The formation charge curve is literally what puts energy into the plate. A curve out of range is a direct predictor of low capacity or low CCA at final test. It is the step that decides whether a battery meets its rating or comes back under warranty.
- Yet nobody correlates curve to test result, because the panel's data dies every time the display rotates to the next value. The operator may glance at it, but no record survives that can be compared with the final test bench.
- Replacing the equipment to get that data means hundreds of thousands of dollars and weeks of downtime in the plant's most sensitive chemical step. So the plant keeps running equipment it cannot learn from, and postpones a decision it cannot afford. Free lead after curing and capacity after formation finally get a process history to be compared against, lot by lot.
Connect in photo mode on the panel — the oven stays exactly as it is.
Connect photo mode over the panel with a fixed industrial camera. Vision OCR with an anchored LLM reads every frame, structures the full time-series curve, and cross-references it with the ERP to know which lot was in process at that moment. Zero modification to the original equipment.
No ports opened, no PLC touched, no retrofit. A camera reads what the operator already sees, and the plant finally keeps the curing or formation curve of every lot next to its final test result. It is the same oven, the same rectifier and the same operator, with memory added from the outside.
The isolated curing and formation panel versus the panel being read
| Aspect | Today | With iLEAN Connect |
|---|---|---|
| Formation charge curve | Visible on screen, then lost | Full time series stored per lot |
| Curing humidity and temperature profile | Spot readings on a sheet | Continuous record per chamber load |
| Low-CCA batteries at final test | No link to the process | Root cause by lot in minutes |
| Which lot was in the rectifier circuit | Reconstructed from memory | Cross-referenced with the ERP |
| Changes to the original equipment | — | None: external camera only |
| Replacement CAPEX over $300K | Pushed onto this year's plan | Deferrable indefinitely |
Zero correlation between curve and final test result → root-cause analysis by lot in minutes. Urgent equipment replacement → indefinitely deferrable.
Impact estimate — to be validated with your numbers.
The block below is an estimate to be validated against your plant's actual data. We put it forward so the committee has an order of magnitude; we refine it during the assessment.
- Estimated payback 5-10 months.
- On top of that, avoided replacement CAPEX above $300K for each oven or rectifier you keep running. That makes it the cheapest way to learn from equipment you were planning to replace anyway.
- Scrap reduction from correlating curve defects with final test, a correlation that is impossible to make today.
- And root-cause analysis on a low-capacity lot goes from guesswork to minutes.
Estimated payback 5-10 months, plus avoided replacement CAPEX (>$300K) and scrap reduction from curve-defect correlation. *Figure to validate*.
And the fair question from the production manager
“Can a camera reading an old panel be trusted as process data?” — here the task is anchored: fixed display, values in known positions and expected physical ranges, where the best models drop below 1.5% error [1]. Any frame whose value falls outside the possible range for that formation program is discarded instead of stored, so the curve never carries an impossible point.
[1] OpenAI paper "Why Language Models Hallucinate", 2025 — on the reliability of AI in anchored tasks.
What people ask about reading curing ovens and formation rectifiers
Do we have to modify the curing oven or the rectifier?
No. The camera is mounted outside the cabinet and reads the display. Nothing is installed on the machine and its control software is left untouched. That is what makes the case approvable by maintenance and by the equipment's original supplier.
Does it capture the whole formation curve or only end values?
The whole curve, frame by frame, structured as a time series. End values you already have; what is missing is the shape of the charge that explains a weak lot. Stored lot by lot, those curves become the basis for comparing good and weak formation programs.
How does it know which battery lot was on charge?
It cross-references the timestamp with the active lot in the ERP or the formation schedule, so every curve is attached to the lot that was actually in the circuit. If the schedule changed on the fly, the operator can correct the link from the tablet before it is stored.
Does it work with analog gauges as well as digital screens?
Yes. Needle gauges and segment displays are read the same way, as long as the camera has a stable view and consistent lighting. Glare and reflections are handled at installation, with the camera angle and a simple hood if needed.
Can it warn before a curing load goes out of profile?
Once the history exists, a drift in humidity or temperature shows up as a trend before it crosses the limit. That is usually the second step after digitizing. With a few months of curves, the plant can also tune curing profiles with data instead of habit.
More cases from this series
- Zero critical defects, fully traced4 coordinated verification rings — ERP, marking, Edge vision and evidence pack — against the critical…
- The audit dossier that builds itselfEvery critical change generates a pre/post photo, log and sign-off. Agents builds the audit dossier by…
- The serial marker that no longer gets hand-typedThe ERP publishes lot, date and model straight to the marker via API. Lot change = one tap, not manual…
- Grid casting start, no paperThe grid casting shift log gets photographed with a phone and lands in the central system at zero-second…
- What the line lead knows now stays on recordThe line lead dictates an incident while walking the floor; iLEAN structures it and replies in seconds,…
- The lab Excel sheet that's already in the ERPILEAN reads the lab's quality Excel sheet and pushes it to the ERP after human validation. Up to -80% on…
Book a demo and walk us through your oldest curing or formation panel.
We work on your plant's real data, not ours. Assessment with no commitment.
Request estimated ROI within 48h ‹ See all cases of automotive batteries See automotive