Spaghetti diagram with AI vision — the operator's real route, not the one on the floor plan.
The spaghetti diagram is the tool that surprises management the most and the one almost no plant keeps alive: it takes days to build and weeks to go obsolete. iLEAN assembles it continuously with Edge vision on the cameras you already have plus Connect against MES/ERP, without touching the layout. The agent reconstructs the aggregated route by workstation, family and shift. The person decides what moves.
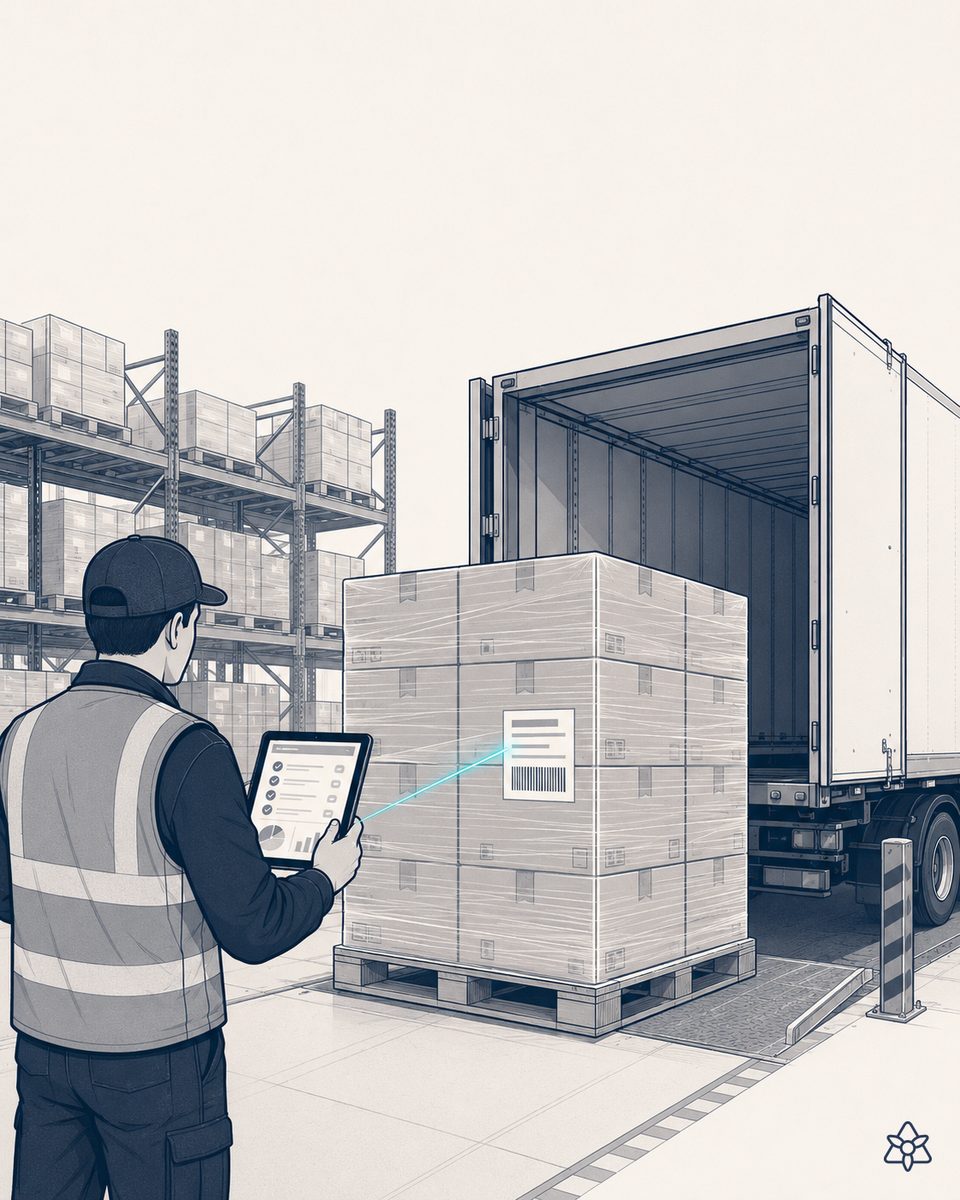
The spaghetti diagram your plant never manages to keep alive.
The spaghetti diagram is the most revealing Lean tool there is — and, paradoxically, the one almost no plant keeps up to date. The reason is always the same and nobody says it out loud: building it by hand costs too much to maintain.
- One person, one shift, one workstation. The classical method is someone from the Lean team with a printed floor plan and a stopwatch following an operator for a whole working day, drawing a line every time they move. For a single workstation.
- And it goes obsolete the moment anything changes. The mix changes, the SKU changes, you move a table: last month's drawing no longer represents the plant. And the plan stays pinned in the improvement room, fossilized.
- It is the most revealing tool — when it actually gets done. The data that comes out is brutal: the operator walking 800 meters per shift because of a badly placed workstation, the carts crossing the same aisle three times, the tooling cabinet 35 meters away from the workstation that uses it most.
- Meanwhile, your workforce keeps on walking. Motion waste is one of the seven (or eight) that Toyota taught — and it still goes unmeasured because measuring it by hand does not scale.
It is the syllogism of the two gaps applied to movement: the data exists (people move around the plant every minute), but it lives nowhere (there was no cheap sensor to record it); and even if we recorded positions, there was no agent to cross them with the production order and draw useful conclusions. AI has just delivered both pieces.
The cameras already hanging in your shop floor are sensors you never used.
iLEAN's argument here is the filler one: you are not here to fill the plant with new sensors, you are here to get value out of the ones you have left unused for years. The security CCTV covers the flow and is wasted watching empty aisles. iLEAN Edge reads it with convolutional networks that detect people (not faces), reconstructs aggregated trajectories and crosses them with your MES and your ERP.
Edge sees the flow. Connect crosses it with the production order. The agent reconstructs the spaghetti by workstation and keeps it alive. The person decides what moves. iLEAN sees the flow, not the people.
The three iLEAN pieces applied to the spaghetti diagram:
- Edge — terminal with computer vision on existing CCTV cameras (or new ones if the plant has none). The CNNs detect bodies on the floor, not faces, with no facial recognition. The trajectory is reconstructed as aggregated data by zone and by shift. It works without a network: if the plant loses connectivity, Edge keeps aggregating locally and synchronizes when it comes back.
- Connect — captures which production order was running at each moment (MES), which SKU and which family (ERP), which workstations were active (the shift manager's spreadsheet, the cell's old panel). Without that layer, the spaghetti is a pretty drawing with no context.
- Agent — crosses the aggregated route with the production order and reconstructs the spaghetti by workstation, by family, by shift. It tells you which workstation concentrates 80% of the wasted motion and simulates which layout change would give back the most seconds per cycle. It proposes — the person decides and signs off the physical change.
Spaghetti diagram with a stopwatch vs. spaghetti diagram with iLEAN
| Aspect | Classical method (stopwatch + floor plan) | With iLEAN Edge + Connect + Agent |
|---|---|---|
| Time to build it | 2-5 days per workstation, one family | Continuous from second zero, every zone |
| Shelf life of the data | Weeks, until the next mix change | Alive, updated daily by shift |
| Coverage | One family, one shift, one week | The whole plant, every shift, the whole mix |
| New sensors | None — just a stopwatch and a floor plan | Software only, on the existing CCTV |
| Privacy / GDPR | A person physically observing another person | Anonymous body detection, no faces, aggregated data |
| Link to the layout change | The Lean team proposes; the improvement room decides | The agent simulates and prioritizes; the person signs the change |
Impact estimate for your plant — to be validated with your numbers.
The block below is an estimate to be validated with the actual data of your plant. We lay it out so the committee has an order of magnitude; we refine it during the immersion.
- Mid-sized plant of 6,000-10,000 m², with 3-5 cells and CCTV already installed in aisles and workstation exits.
- Edge pilot in one zone (reading the existing CCTV + integration with the production order from the MES). First expected value within a few weeks: the first heat map of the real flow, already discussable with the Lean team.
- Travel reduction at the pilot workstation ≥ 30% after the first assisted layout-change cycle — hard lever: cycle seconds recovered × steps per shift × days per year.
- Indicative payback between 4 and 9 months, depending on the documented motion waste and the hourly cost of the workstation.
And the nuance that matters
A live spaghetti diagram is exactly the difference between a plant that can redesign its layout every quarter and one that redesigns nothing: the plant that knows continuously how its people move can act; the one that does not, cannot. The reliability nuance matters too — a general-purpose model asked an open question can make things up, whereas an agent anchored to your camera stream, your MES order and your ERP master data answers over verified data or says it does not know [1]. iLEAN sees the flow, not the people — and the counter-model (the lights-out shop floor where there is no flow because there are no people) does not build anything that lasts.
[1] OpenAI paper "Why Language Models Hallucinate", 2025 — on the reliability of AI in anchored tasks.
What people ask about the spaghetti diagram with AI vision
What is a spaghetti diagram and what is it for?
The spaghetti diagram is the Lean tool that draws, on the plant floor plan, the actual route a person (or a material) covers during the shift. It makes visible what nobody sees at a glance: how many times the operator crosses the shop floor for the same part, how many extra steps a badly placed workstation costs, how much of the shift goes into simply walking. The name comes from the drawing: when you finish it, it looks like a plate of spaghetti. Every crossing line is pure waste — motion that adds no value.
Why does almost nobody keep their spaghetti diagram up to date?
Because building it the classical way takes days: someone from the Lean team with a stopwatch and a printed floor plan following another person for a full shift, drawing lines by hand. For one family or one workstation. And it goes obsolete as soon as the mix, the SKU or the layout changes. Keeping it alive is impractical with people. That is why spaghetti diagrams usually sit in last year's folder — while the plant lives in the present.
How does iLEAN build the spaghetti diagram with AI vision?
iLEAN Edge reads the cameras already installed on the shop floor (the security CCTV, or new cameras where there are none) with convolutional neural networks that detect people, not faces. It anonymizes, records aggregated trajectories and cross-references them with the production order from the MES and the WIP inventory from the ERP. The agent reconstructs the spaghetti by workstation, by family, by shift — and keeps it alive. Where there used to be a drawing from last quarter, there is now a heat map with this week's reality.
Isn't this about watching the workforce?
No. iLEAN sees the flow, not the people. Vision detects bodies on the floor in order to reconstruct aggregated trajectories — no facial recognition, no name attached to a route, no individual metric per shift. The goal is to eliminate the travel nobody should be doing: the badly placed workstation, the cart missing where it is needed, the 800 meters a day the shift operator ends up walking because the plant was laid out this way fifteen years ago. It verifies the process, not the person — it assists and simplifies the work. Works councils and GDPR fit that configuration.
What do you do with the spaghetti diagram once it is alive?
You cross it with the VSM and the line balance (Yamazumi) and it starts talking to you on its own: the agent tells you which workstation concentrates 80% of the motion waste, which layout change would give back the most seconds per cycle, which families are worth moving from one cell to another. And when you apply a change, you see the effect the next day, not the next quarter. That is kaizen with real data — not kaizen with intuition.
Keep pulling the thread: All Lean methods
More cases in lean manufacturing
- AI skills matrix for operators — the matrix that updates itself with what really happens on the floor.How iLEAN cross-checks training, certificates and per-operator performance so your skills matrix shows…
- SMED: AI-timed quick changeoveriLEAN times SMED changeovers with computer vision, auto-splits internal/external setup, cuts changeover…
- Lean Manufacturing softwarethat doesn't ask you to learn it.Lean Manufacturing software with industrial AI: 5S, Kanban, TPM, SMED, Six Sigma digitized.…
- Real-time SPC with AI — statistical process control that reacts while you can still correct, not once you are already out.iLEAN Edge + Agents bring SPC to real time: live Xbar-R charts, automatic Western Electric rules,…
- Standard work with AI vision — the standard stops being a laminated sheet on the wall and comes back to the station, alive.iLEAN Edge compares the station's sequence against the standard and catches the deviation in the moment.…
- Toyota Production System — the origin of Lean ManufacturingThe Toyota Production System (TPS) is the foundation of modern Lean. Its two pillars — Jidoka and…
Tell us about your case and within 48h we'll send you the estimated ROI of this AI project for your plant.
We work on your plant's real data, not ours. Diagnostic with no strings attached.
Request estimated ROI in 48h See Lean Manufacturing