Particle size of the milled batch — a distribution correlated with application, not a loose sample.
Two batches with the same D50 can behave differently in application: the coarse tail (D90, D99) decides gloss, filterability and specks; the fines, rheology and color development. Today the laser diffraction analyzer delivers the whole curve… and the batch record gets one number, from one sample taken at the end. iLEAN Connect captures the full distribution of every measurement, Tracer ties it to the batch and crosses it with that batch's application results — and with the history, what a loose sample never shows appears: drift.
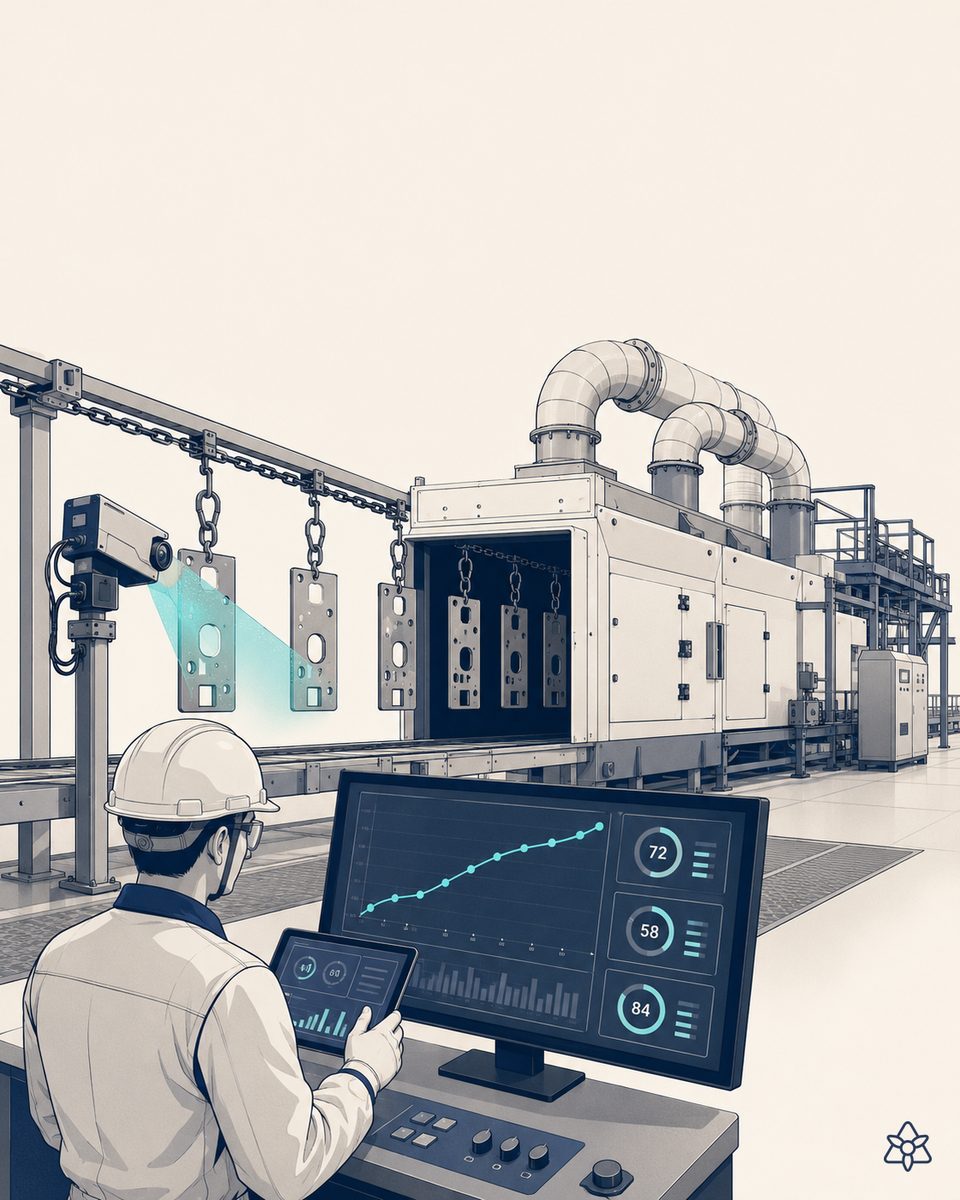
A full curve in the analyzer, a single number on the record — and the link to application living in two people's heads.
The lab measures well; what gets lost is everything around the measurement:
- The analyzer measures the curve; the record keeps a number — the laser diffraction unit (Malvern, Beckman, Horiba…) delivers the full distribution, but what reaches the batch record is a D50 typed by hand.
- One sample at the end of the batch — it says nothing about homogeneity or about how the grind evolved; two very different milling histories can end at the same spot value.
- The grind-to-application link is tribal knowledge — which coarse tail still runs clean through the filter, which fines shift the rheology: it lives in the quality veteran's memory, not in data. When that person is away, it is gone.
- Slow drift is invisible in one sample — bead wear, a premix supplier change: you do not see it in one measurement, you see it across a hundred. And nobody is looking across a hundred.
The result: batches "in spec" on particle size that misbehave in application, and nobody can say why with data. A spec is defended with the curve and its history, not with a loose number.
iLEAN does not change your analyzer — it takes the whole curve to the batch and crosses it with application.
Particle size control does not fail for lack of equipment; it fails because the curve never travels with the batch or gets crossed with its result. iLEAN acts as the putty between the analyzer, the batch record and application QC, without changing the lab's method.
Connect captures the full distribution from the analyzer. Tracer ties it to the batch. The agent crosses it with application results and flags drift before it becomes a complaint.
The iLEAN pieces applied to particle size control:
- Connect — integrates with the laser diffraction analyzer or particle counter through whichever channel it offers (file export, network output, its own software) and captures the complete curve (D10, D50, D90, D99 and the full distribution) of every measurement, with no retyping.
- Tracer — ties each curve to its batch, pass and sample, and stores alongside it the application QC results of that same batch (tint strength, gloss, filter residue).
- Particle size agent — compares the batch's curve against the pattern of batches that applied well. If the coarse tail grows batch after batch — worn beads, a different premix — it warns before the problem reaches application. The person decides — the agent shows the data.
Spot sample vs. distribution correlated with iLEAN
| Aspect | End-of-batch sample + record | With iLEAN Connect + Tracer (curve per batch) |
|---|---|---|
| Recorded data | One D50 typed on the record | The complete curve, tied to the batch |
| When it is measured | One sample at the end | Every measurement, with pass and time |
| Coarse tail (D90/D99) | Checked when there is a problem | Watched batch by batch |
| Link to application | In the quality veteran's memory | Curve and application result, together per batch |
| Slow drift (beads, premix) | Invisible until the complaint | Trend visible, with warnings |
| Defense against a claim | Reconstructing paperwork | The batch's full history in one click |
Impact estimate for your plant — to be validated with your numbers.
The block below is an estimate to be validated with the specific data of your plant. We put it forward so the committee has an order of magnitude; we refine it during the diagnostic.
- Pigment grinding for inks, coatings or masterbatch with a laser diffraction analyzer in the QC lab.
- Pilot: Connect integration with the analyzer + Tracer on one product family. First value expected within a few weeks.
- Indicative payback between 6 and 12 months, depending on the cost of complaints and reworks tied to application behavior.
- Hard levers: fewer batches "in spec but wrong in application"; drift caught before the complaint; internal specs tightened with data instead of memory.
And the technical manager's reasonable doubt
"What if the correlation the agent shows is a coincidence?" — it can be, and that is why the agent never changes a spec on its own: it shows the curve, the history and the application result, and it is the technical manager who decides whether to adjust the process. Hallucination is a problem of free generation, not of anchored tasks: where the AI merely captures instrument data and compares trends, the best models brought error below 1.5% [1]. The agent shows the data — the person concludes.
[1] OpenAI paper “Why Language Models Hallucinate”, 2025 — on the reliability of AI in anchored tasks.
What people ask about particle size grind control
Why is D50 not enough to characterize a milled pigment?
Because D50 only says where the middle of the distribution sits. Two batches with the same D50 can carry very different tails: a heavier coarse tail (D90, D99) means lower gloss, specks and filters that clog; more fines mean different rheology and color development. Application behavior is decided by the shape of the whole distribution — which is exactly the part that gets thrown away when the batch record keeps a single number.
What gets lost when you measure only one sample at the end of the batch?
Three things: homogeneity — one draw from one point says nothing about the rest of the batch; trajectory — how the grind evolved, which is what tells you whether the mill is behaving like it did last month; and comparability — a spot value cannot be correlated with application results in any robust way. The end sample answers "does this batch pass?", but never "is the process drifting?"
How does iLEAN integrate with the lab's laser diffraction analyzer?
iLEAN Connect talks to the analyzer through whichever channel it offers — file export, serial or network output, or its own software — and captures the complete distribution of every measurement, not a retyped summary. Each curve lands tied to batch, sample and time via Tracer. The lab keeps its method, its equipment and its measurement routine; what disappears is the manual typing and the loose files.
How does the agent detect drift from bead wear or a premix change?
By looking where no person has time to look: across batches. The agent tracks the distribution parameters (D50, D90, D99, span) of every batch of the same product and compares them against the pattern of batches with good application results. When the coarse tail creeps up batch after batch — typical of worn beads — or the curve shifts after a raw material change, it warns the technical manager with the trend in front of him. The person decides; the agent shows the data.
What does the lab gain, and what does production gain?
The lab stops typing and starts deciding: every curve is captured automatically, tied to its batch, and complaints are answered with history instead of archaeology. Production gains an early-warning system: drift caught weeks before it becomes rejected batches, and internal specs that can be tightened — or defended to a customer — with data. All as an estimate to validate with your plant's numbers.
More cases in other sectors
- Masterbatch color blending in plastics — batch color matches the master, without relying on the operator's eye.How iLEAN verifies masterbatch identity and actual dosing and measures the ΔE of the first parts against…
- Inline offset ink viscosity control during the press run — solvent corrected before density drifts off.How iLEAN captures Ford cup checks and inline viscometer readings during the press run and flags…
- Pigment dispersion in a bead mill — stop at the right fineness, without over-milling.How iLEAN captures Hegman fineness and bead mill parameters pass by pass, so you stop at spec without…
- Powder coating booth control — thickness and powder recovery in check, without giving powder away or living with rejects.How iLEAN cross-references film thickness, gun parameters and powder consumption per part number in the…
- Safety data sheet traceability — which SDS version went to which customer, with which batch.How iLEAN Tracer ties every chemical shipment to the safety data sheet version in force at that moment:…
- Specialty batch reactor — every batch compared live against the golden batch curve, not caught at final QC.How iLEAN overlays every specialty chemicals batch on the curve of your golden reference batch, live and…
Tell us your case and in 48h we'll send you the estimated ROI for your pigment grinding.
We work on your plant's real data, not ours. Diagnostic with no commitment.
Request estimated ROI in 48h See specialty chemicals