Hoshin Kanri for the industrial CEO — the X-matrix with live KPI, not last month's.
Today the industrial CEO looks at last month's KPI. The Hoshin Kanri cascade stays on the committee-room wall and the data arrives hand-consolidated by the controller. iLEAN brings the X-matrix live to the executive desk — from the shop-floor workstation to the chief executive, with nobody consolidating anything by hand. The committee discusses the plan, not the spreadsheet.
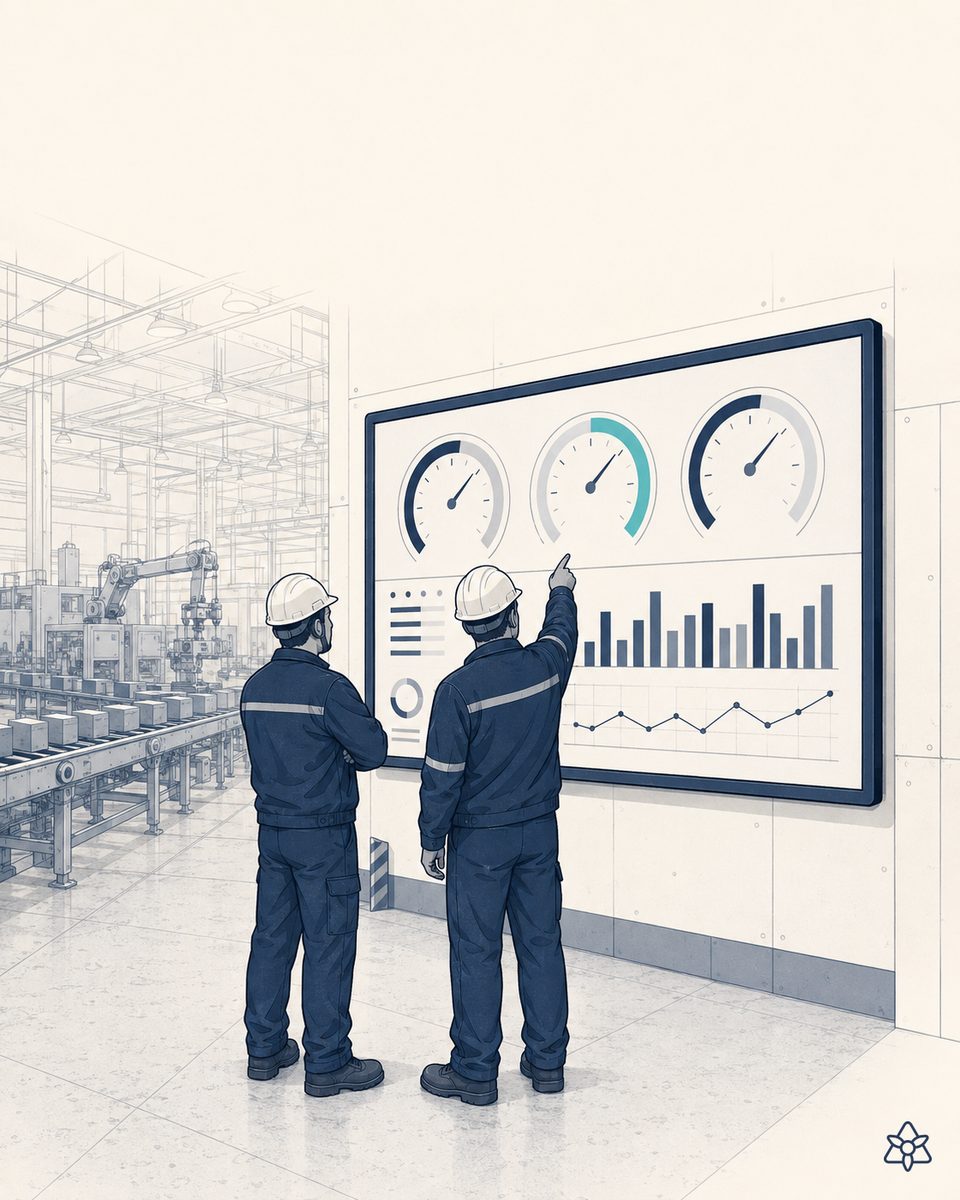
The Hoshin Kanri cascade is perfect — until you have to measure it.
Hoshin Kanri (the X-matrix, the cascade of objectives from committee to plant and back) is one of the most solid Lean methods there is. The method is not the problem. The problem is that, the moment you have to measure whether the plan is on track, the data travels the way it did in 1995: someone at each plant consolidates a spreadsheet, someone else at corporate merges them, and the CEO looks at a chart two weeks after month-end close.
It is the same old syllogism: there is a strategic objective, there is an indicator at every workstation feeding it, there is data in SCADA/MES/ERP measuring that indicator. But between the data and the CEO's chart there are three people, two spreadsheets and a slide deck. That chain eats time and, worse, trust: when one plant reports differently from another, the entire Hoshin review is spent arguing where each number came from instead of discussing the plan.
And in multi-plant groups the problem multiplies: each plant consolidates by its own criteria, the corporate committee receives spreadsheets with different definitions, and the board debate turns into accounting archaeology instead of industrial strategy.
iLEAN does not replace your Hoshin Kanri — it closes the cascade's measurement loop.
Hoshin Kanri is excellent at designing the plan and the cascade. What it lacked for decades is the central brain that keeps the KPI live without anyone consolidating by hand. That is the filler iLEAN provides — it seals the crack between the data already circulating on the floor and the indicator the committee needs, without asking you to change the X-matrix, the BI or the ERP.
The data lives in islands; the plan lives on a wall. iLEAN connects the islands and brings the plan live to the executive desk. The CEO discusses the plan, not the spreadsheet.
The three iLEAN pieces applied to real-time Hoshin Kanri:
- Connect — captures the data from every workstation and every plant wherever it lives: modern SCADA/MES, the panel of an old machine via photo, the controller's spreadsheet, a shift report dictated by voice. Standardized at second zero, without forcing you to change anything already in place.
- Brain — the central piece that holds up the X-matrix cascade. It maintains the map of objective → indicator → data source → accountable workstation, and aggregates in real time from the workstation to the chief executive. Same data, same criteria, every plant.
- Agent + Writer — the agent tracks deviations against the plan (and proposes actions to the plant manager when a KPI drifts); the Writer prepares the executive dossier for the committee and for the CEO, automatically, with live data and traceability behind every figure.
Traditional Hoshin Kanri vs. Hoshin Kanri with live KPI
| Aspect | Traditional Hoshin Kanri | With iLEAN Brain + Writer + Agent |
|---|---|---|
| KPI frequency to the CEO | Monthly, 1–2 weeks late | Live, same day |
| Cross-plant consolidation | Manual, different criteria per plant | Automatic, same criteria |
| Data origin | The controller's spreadsheet | SCADA/MES/ERP + capture of data islands |
| Hoshin review | Arguing where the data came from | Discussing the plan |
| Deviations from plan | Seen at month-end close | The agent flags them as they happen |
| Multi-plant sovereignty | Tension between plant and corporate | Security rings: each plant keeps its own |
Impact estimate for your plant — to be validated with your numbers.
The block below is an estimate to be validated with your group's actual data. We lay it out so the committee has an order of magnitude; we refine it during the diagnostic.
- Industrial group with 3–6 plants, annual X-matrix already in place, corporate BI in use, KPI hand-consolidated by the controller every month.
- Connect + Brain pilot on one plant and a bounded set of strategic X-matrix KPI (typically 5–10 KPI per level). First value expected within a few weeks: the CEO sees the first live KPI on their desk before the next month-end close.
- Reduction in consolidation time ahead of the Hoshin review estimated at ≥ 40%. Indicative payback between 4 and 9 months, depending on controller hours/month freed up plus the value of decisions that no longer wait for month-end close.
- The hard lever is not only saved hours — it is earlier decisions. A deviation from plan corrected the same day costs something very different from one corrected 30 days later.
And the external evidence that carries weight in the boardroom
The board's first question about an AI-fed KPI is always the same: can we trust it? The published research is clear that language models fail precisely when they are pushed to guess without a factual anchor [1]. That is why iLEAN never invents an indicator: every figure the CEO sees is anchored to a real, traceable source from the floor — SCADA, MES, ERP, a verified capture — and the chain from workstation to boardroom can be opened at any point. Real-time Hoshin Kanri is not one more system; it turns the data you already have into an earlier decision, which is what a board reads as sustained competitive advantage rather than IT spend.
[1] OpenAI paper "Why Language Models Hallucinate", 2025 — on the reliability of AI in anchored tasks.
What people ask about real-time Hoshin Kanri
How does a KPI cascade from the workstation up to the CEO?
The Hoshin Kanri X-matrix already defines the cascade — strategic objective → tactical objective → plant objective → workstation indicator. What iLEAN does is close the measurement loop in real time: every workstation KPI is fed by the real data (OEE, scrap, lead time) already flowing through SCADA/MES, aggregated to plant level, compared against the plan, and pushed up to the CEO's desk. The chief executive no longer waits for month-end close; the drift is visible the day it happens.
Does real-time data work if our data lives in different systems?
Yes — that is exactly the scenario it was designed for. The classic gap in Hoshin Kanri is not the method: it is that data lives in islands (ERP, MES, SCADA, the controller's spreadsheet, each plant's production sheet). iLEAN Connect acts as filler: it captures every source as it is (even a forgotten spreadsheet or the panel of an old machine) and delivers it to the Brain unified. Without forcing you to change anything you already have.
Does it integrate with our corporate BI?
Yes. BI draws beautifully whatever reaches it, but it is only as good as the data feeding it — and most industrial BI renders an incomplete reality with great artistry, because plant data arrives late and in islands. iLEAN sits underneath the BI: it feeds the KPIs with live, traceable data, so the dashboard the CEO already opens stops being a portrait of last month and becomes today's thermometer.
What about multi-plant groups?
The multi-plant X-matrix is where Hoshin Kanri shines — and where the classic method breaks down most, because each plant consolidates its own way and the corporate committee receives spreadsheets built on different criteria. iLEAN standardizes the data at the moment of capture (the R in IRIS), so plant-to-plant comparison is made on the same reality. And the three security rings let each plant keep its local sovereignty while corporate sees the aggregate.
How much does it cut the time spent on the Hoshin review?
Estimate to be validated with your team: the traditional Hoshin review spends much of its time arguing about the data (where it comes from, why this number does not match that one). When the data is live and identical for everyone, the meeting is freed up to discuss the plan. In plants where we have seen it, the reduction in consolidation time ahead of the meeting is in the order of 40–60%. The committee spends those hours on strategy, not on spreadsheets.
Tell us about your case and within 48h we'll send you the estimated ROI of real-time Hoshin Kanri for your group.
We work on the real data of your cascade and your X-matrix, not on ours. Diagnostic with no commitment.
Request estimated ROI in 48h See Hoshin Kanri